
Fig 3.
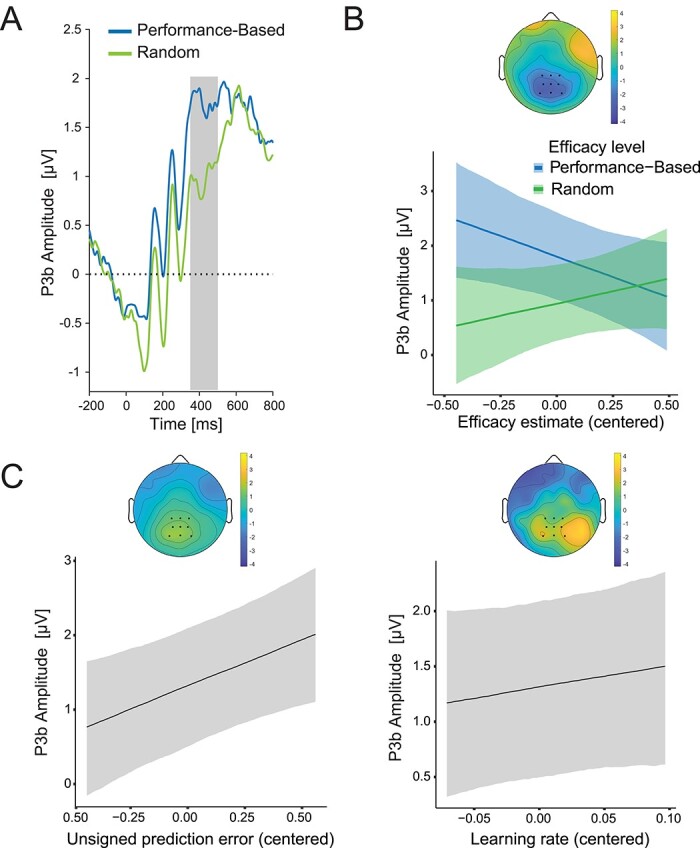
P3b reflects dynamically changing efficacy estimates during processing of efficacy feedback in Study 1. A) ERP average for the P3b locked to the onset of the efficacy feedback separately for performance-based and random feedback. The gray area shows the time window used for quantifying the P3b. B) LMM predicted P3b amplitudes are plotted for performance-based and random feedback as a function of efficacy estimates. The topography shows the interaction of efficacy estimate with efficacy feedback in the P3b time window. C) Predicted (centered) effects of unsigned prediction errors (left) and model-based learning rates (right) on the P3b. Shaded error bars represent 95% confidence intervals. Topographies display fixed-effects estimates.