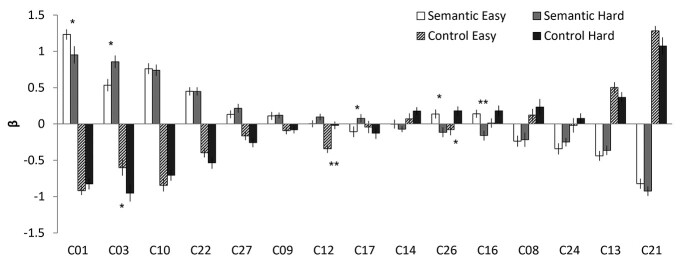
Fig. 2.
The results of temporal regression analysis. Bar graph shows the mean β weight for each condition against the baseline. White and grey bars represent SE and SH conditions, respectively. Patterned and black bars represent CE and CH conditions, respectively. Error bars indicate standard errors. Significant difference between easy and hard conditions is shown with * P < 0.05, ** P < 0.01.

