
Fig. 4.
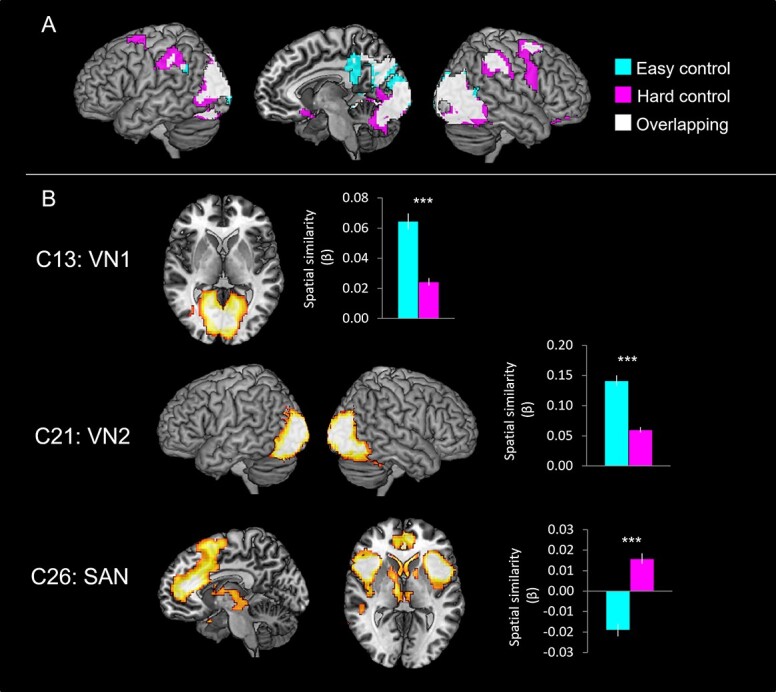
A) The GLM results of the control task. Cyan color indicates brain regions activated during the easy control processing and pink color indicates brain areas during the hard control processing. White color represents the overlapping regions. B) The ICA results of the control task. The temporal regression analysis identified that C13, C21, and C26 were significantly involved in the control task. The spatial regression analysis showed the spatial overlapping between the GLM results and the ICs. Cyan bars represent the spatial β weights for the easy condition and pink bars for the hard condition. ***PFDR- corrected < 0.001.