
Fig. 5.
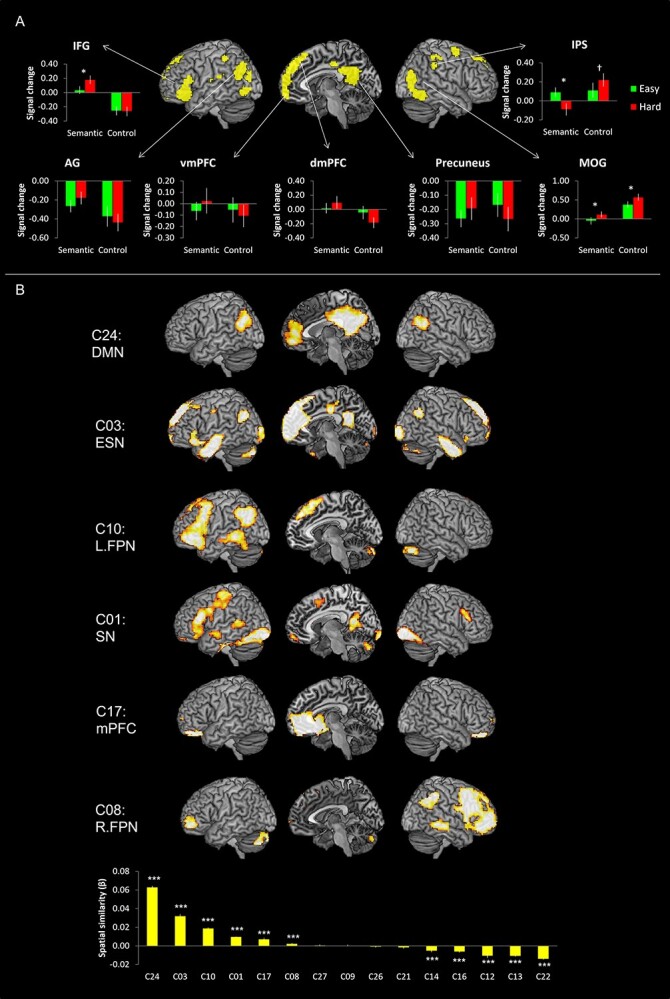
A) The GLM results of the interaction between task and difficulty. Green bars represent regional signal changes for the easy condition and red bars for the hard condition. B) The spatial regression results. The spatial regression analysis identified that C01, C03, C08, C10, C17, and C24 were significantly associated with the brain activation map of the interaction between task and difficulty. *P < 0.05, †P = 0.06, ***PFDR- corrected < 0.001.