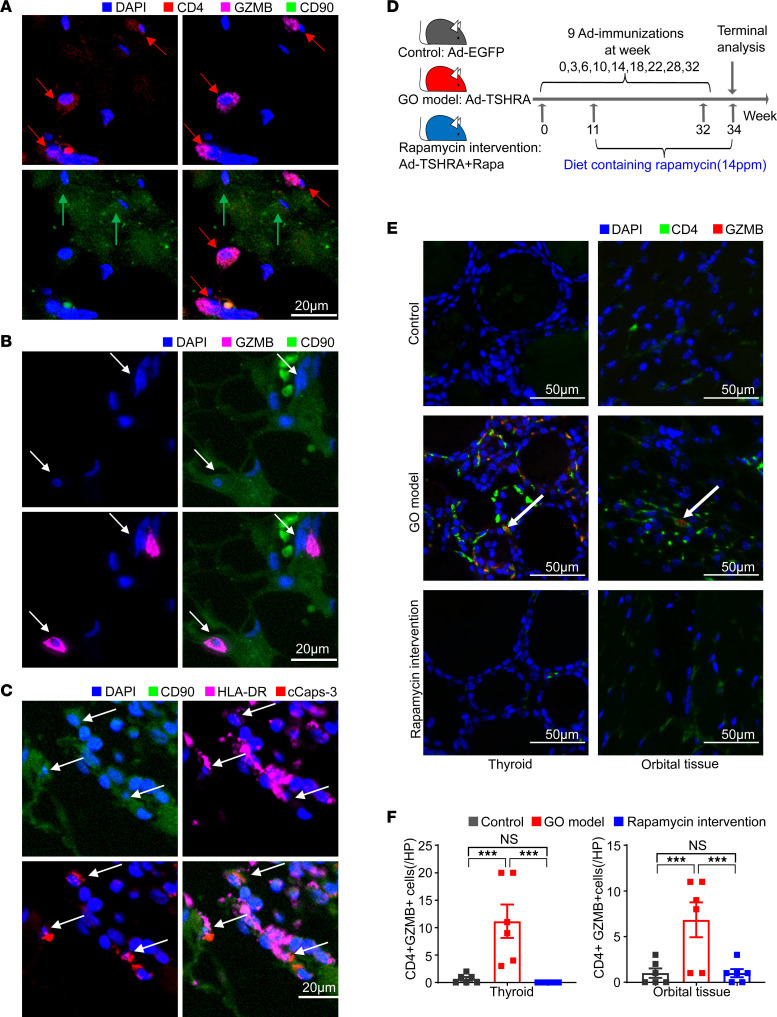
Figure 1. Rapamycin significantly decreases CD4+ CTL accumulation and suppresses their function in GO mice.
(A) Representative multicolor immunofluorescence image showing CD4+GZMB+ T cells (indicated by red arrows) accumulate in the vicinity of CD90+ fibroblasts (indicated by green arrows) in orbital tissue from patients with GO. (B) Represe ntative multicolor immunofluorescence image showing the CD90+ fibroblasts with GZMB visible within the cytosol, suggesting that fibroblasts may represent targets of CD4+ CTL–directed cytotoxicity. (C) Multicolor immunofluorescence images of cCasp-3+ and HLA-DR+CD90+ fibroblasts (indicated by arrows) in orbital tissue from patients with GO. (D) Animal study design. Control mice were immunized with Ad-EGFP, GO mice were immunized with Ad-TSHRA, and rapamycin intervention mice were immunized with Ad-TSHRA while fed a diet containing rapamycin from week 11 until the end of the experiment (14 ppm, 23 weeks). (E) Representative example of thyroid and orbital tissue from the 3 groups of mice by fluorescent multiplex IHC showing coexpression of CD4 and GZMB (indicated by white arrows). (F) Bar plots exhibited counts of CD4+GZMB+ T cells in thyroid and orbital tissue from the 3 groups of mice (n = 6 in each group). Values represent the mean ± SEM. ***P < 0.001, by 2-tailed, unpaired Mann-Whitney-Wilcoxon rank test for F.

