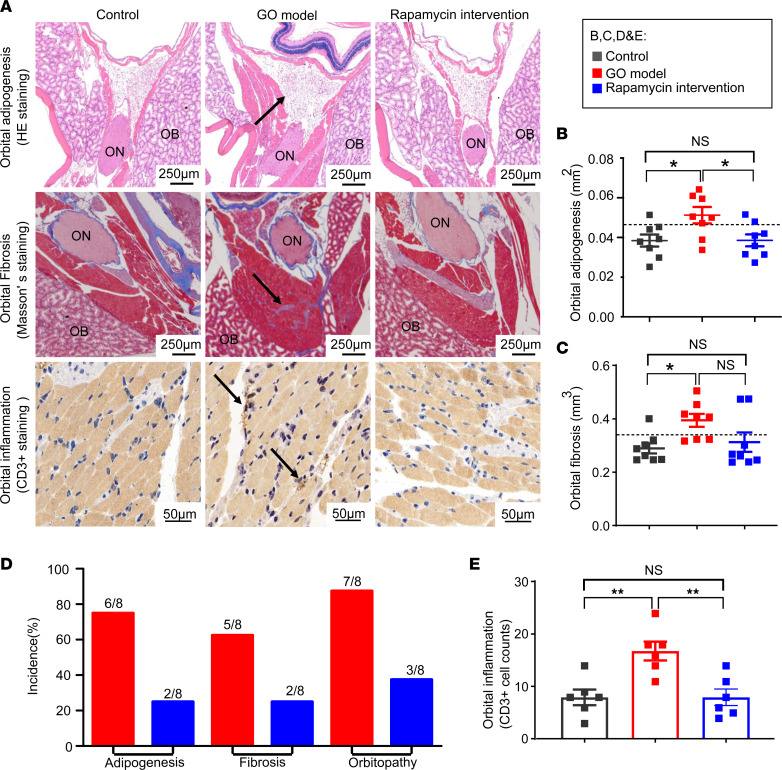
Figure 2. Rapamycin significantly ameliorates orbitopathy in GO mice.
(A) Representative microscopy images of orbital fibrosis, adipogenesis, and inflammation in mice (indicated by black arrows). ON, optic nerve; OB, orbital bones. (B and C) Scatterplots of fibrosis volume and adipogenesis area in orbits from the 3 groups of mice (n = 8 for each group). The dashed line shows the mean + 2 SDs of the value for control mice, which was considered the normal range. (D) The incidences of fibrosis, adipogenesis, and orbitopathy in GO mice and rapamycin intervention mice. The incidences of fibrosis and adipogenesis: the mean + 2 SDs of control mice was regarded as the normal range, and higher values indicated significant positivity. The incidence of orbitopathy: existing orbital pathogenesis including fibrosis and adipogenesis. (E) Bar plots exhibited counts of CD3+ T cells in orbital tissue from the 3 groups of mice (n = 6 for each group). Values represent the mean ± SEM. *P < 0.05, **P < 0.01, and NS P > 0.05, by 1-way ANOVA and post-ANOVA, pairwise, 2-group comparisons with Tukey’s method for B, C, and E.

