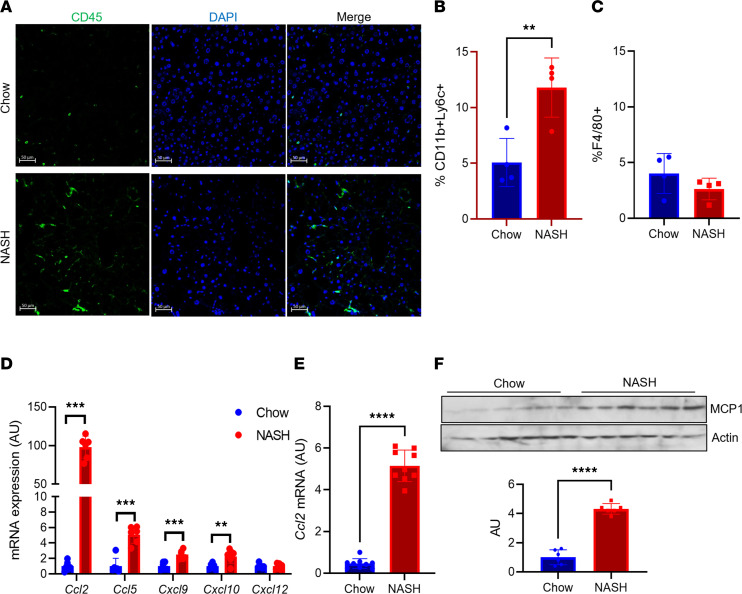
Figure 1. Liver MCP-1 expression is increased in NASH diet–fed mice.
(A) Representative images of CD45+ cells in livers from chow- and NASH diet–fed wild-type (WT) male C57BL/6J mice. (B) FACS analysis of CD11b+Ly6C+ and (C) CD11b+F4/80+ cells from nonparenchymal cells (NPCs) isolated from chow- and NASH diet–fed WT male mice (n = 4 mice/group). (D) Gene expression of key chemokines in hepatocytes isolated from chow- and NASH diet–fed WT male mice (n = 6 mice/group). (E) Ccl2 gene expression in whole liver from chow- and NASH diet–fed WT male mice (n = 9 mice/group). (F) MCP-1 protein and quantitation in whole liver from chow- and NASH diet–fed WT male mice (n = 6 mice/group). MCP-1 and actin blots are derived from the same samples run contemporaneously in parallel gels. Scale bars: 50 μm. All data are shown with group means ± SEM; **, P < 0.01, ***, P < 0.001, ****, P < 0.0001 by 2-tailed t test.

