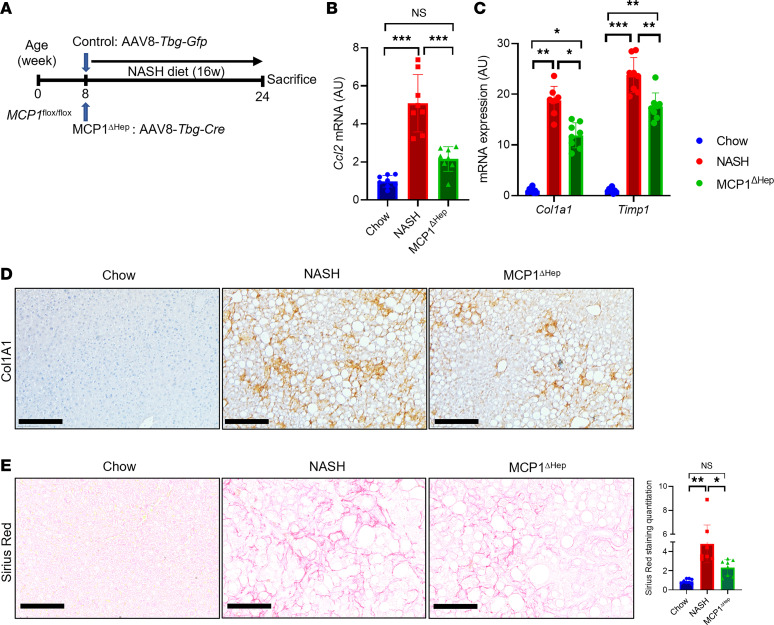
Figure 3. MCP-1 loss of function reduces liver fibrosis with NASH diet for 16 weeks.
(A) Experimental schematic for hepatocyte-specific MCP-1-knockout mice. Male 8-week-old MCP-1fl/fl mice were transduced with AAV8-Tbg-Gfp (Control) or AAV8-Tbg-Cre to generate MCP-1ΔHep male mice, then fed with NASH diet for 16 weeks (n = 8 mice/group). (B) Gene expression for liver Ccl2 from chow- or NASH diet–fed control mice or MCP-1ΔHep male mice (n = 8 mice/group). (C) Markers of HSC activity from chow- or NASH diet–fed control mice or MCP-1ΔHep male mice (n = 8 mice/group). (D) Representative IHC image of Col1a1 protein expression from chow- or NASH diet–fed control mice or MCP-1ΔHep male mice. (E) Liver Sirius red staining and quantitation in control and MCP-1ΔHep male mice (n = 8 mice/group). Scale bars: 50 μm. All data are shown with group means ± SEM; *, P < 0.05, **, P < 0.01, ***, P < 0.001 by 1-way ANOVA followed by Tukey’s multiple comparisons test.

