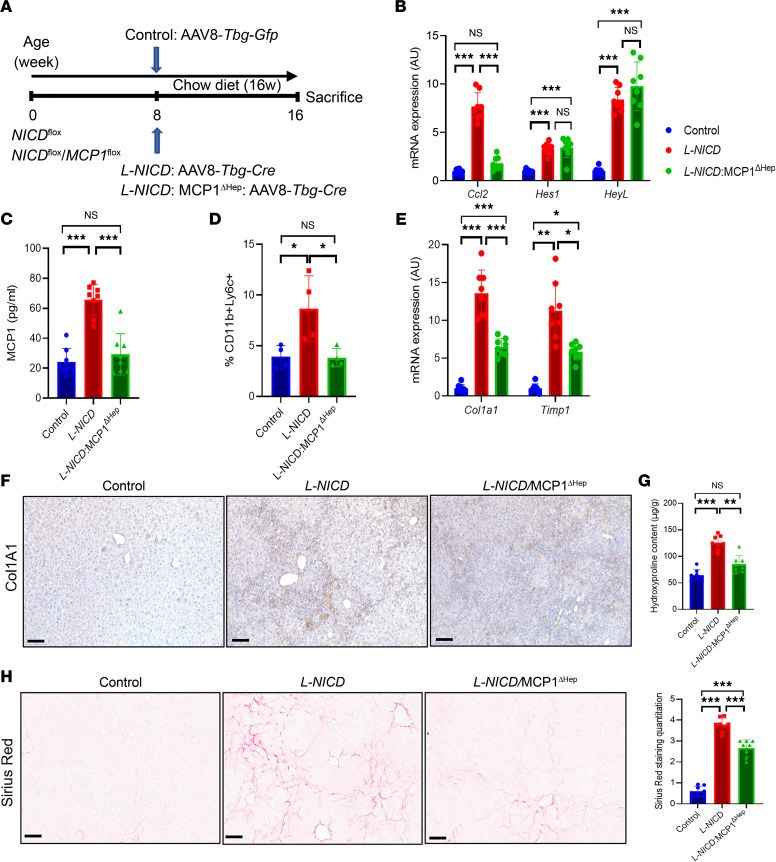
Figure 7. Notch-induced MCP-1 drives profibrotic macrophage infiltration and liver fibrosis.
(A) Chow-fed NICDfl/fl and NICDfl/fl MCP-1fl/fl were transduced with AAV8-Tbg-Gfp or AAV8-Tbg-Cre to generate control, L-NICD, and L-NICD MCP-1ΔHep male mice (n = 8 mice/group). (B) Liver Ccl2 and Notch target gene expression and (C) serum MCP-1 levels in control, L-NICD, and L-NICD MCP-1ΔHep male mice (n = 8 mice/group). (D) FACS analysis of nonparenchymal cells (NPCs) isolated from livers of control, L-NICD, and L-NICD MCP-1ΔHep male mice (n = 4 mice/group). (E) Gene expression for markers of HSC activity from livers of control, L-NICD, and L-NICD MCP-1ΔHep male mice (n = 8 mice/group). (F) Representative IHC image of Col1a1 protein expression from livers of control, L-NICD, and L-NICD MCP-1ΔHep male mice. (G) Hydroxyproline content from livers of control, L-NICD, and L-NICD MCP-1ΔHep male mice (n = 8 mice/group). (H) Liver Sirius red staining and quantitation in control, L-NICD, and L-NICD MCP-1ΔHep male mice (n = 8 mice/group). Scale bar: 50 μm. All data are shown with group means ± SEM; *, P < 0.05, **, P < 0.01, ***, P < 0.001 by 1-way ANOVA followed by Tukey’s multiple comparisons test.

