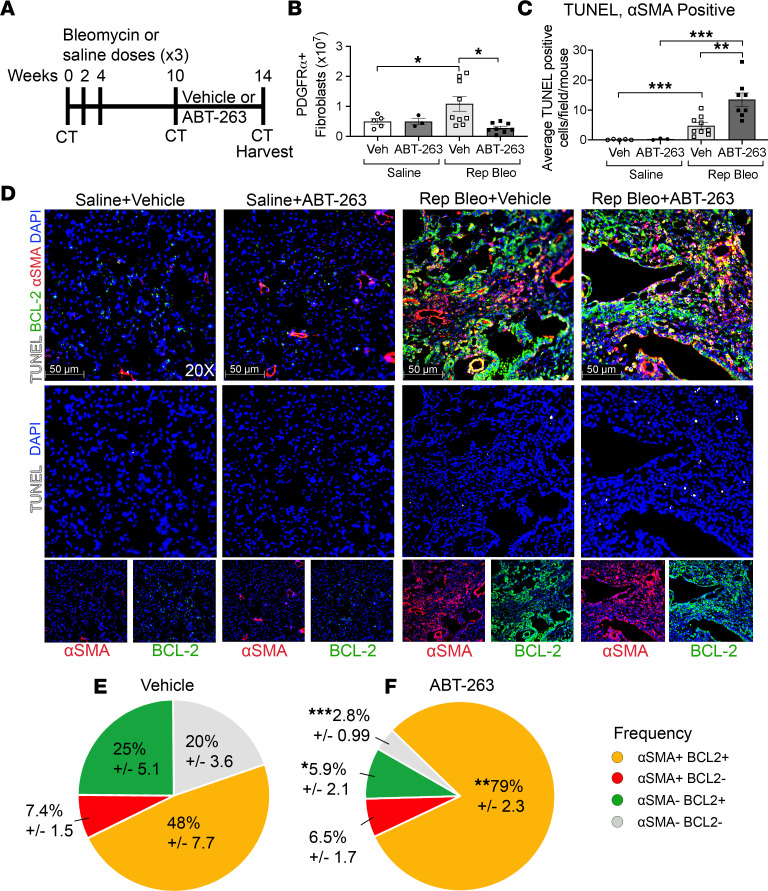
Figure 5. ABT-263 induces BCL-2+α-SMA+ fibrotic fibroblast apoptosis in progressive pulmonary fibrosis after repetitive bleomycin.
(A) Schematic of repetitive dosing, ABT-263 treatment, CT, and harvesting schedule. (B) Quantification of Lin–PDGFRα+ fibroblast population. (C) Quantification of TUNEL+α-SMA+ cells per HPF and (D) representative images after immunofluorescence staining of lungs for BCL-2 (green), α-SMA (red), DAPI (blue), and TUNEL (white) in repetitive saline and repetitive bleomycin mice treated with vehicle or ABT-263. Pie charts demonstrating frequency of TUNEL+: α-SMA+BCL-2+, α-SMA+BCL-2–, α-SMA–BCL-2+, and α-SMA–BCL-2– cells in repetitive bleomycin mice treated with (E) vehicle or (F) ABT-263. Asterisks represent significant differences in frequency between vehicle and ABT-263–treated fibrotic mice. Graphed as scatterplot with bar, mean ± SEM, or time-course line graph with mean ± SEM. *P < 0.05, **P < 0.01, ***P < 0.001, 2-tailed t test with Welch’s correction. Total magnification with objective 200×.

