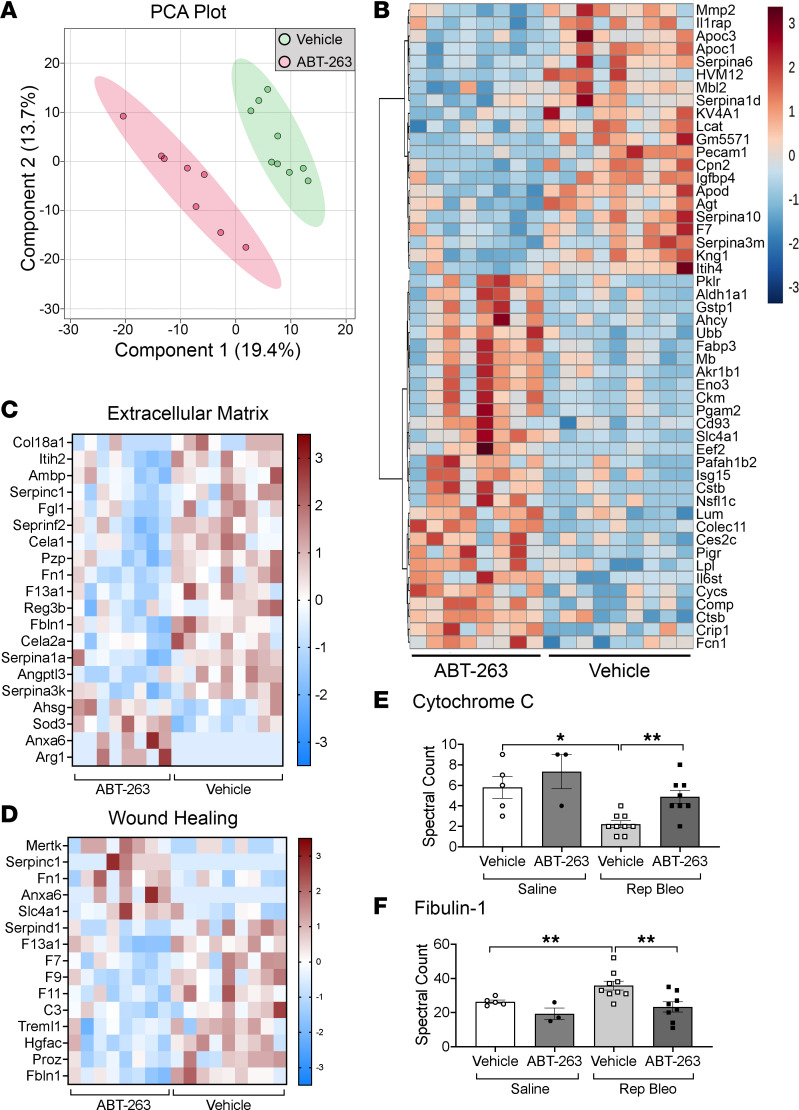
Figure 8. Serum proteomic analysis reveals potential biomarkers of ABT-263 antifibrotic activity.
(A) PCA of global proteomic patterns between vehicle- and ABT-263–treated fibrotic mice. (B) Heatmap of normalized signal shows translational differences between vehicle and ABT-263 treatment. Heatmap of differentially abundant proteins in the enrichment pathways and associated proteins for (C) ECM and (D) wound healing. Spectral counts of (E) cytochrome c and (F) fibulin-1 by mass spectrometry analysis. n = 8–9/group. Graphed as scatterplot with bar, mean ± SEM. *P < 0.05, **P < 0.01, 2-tailed t test with Welch’s correction.

