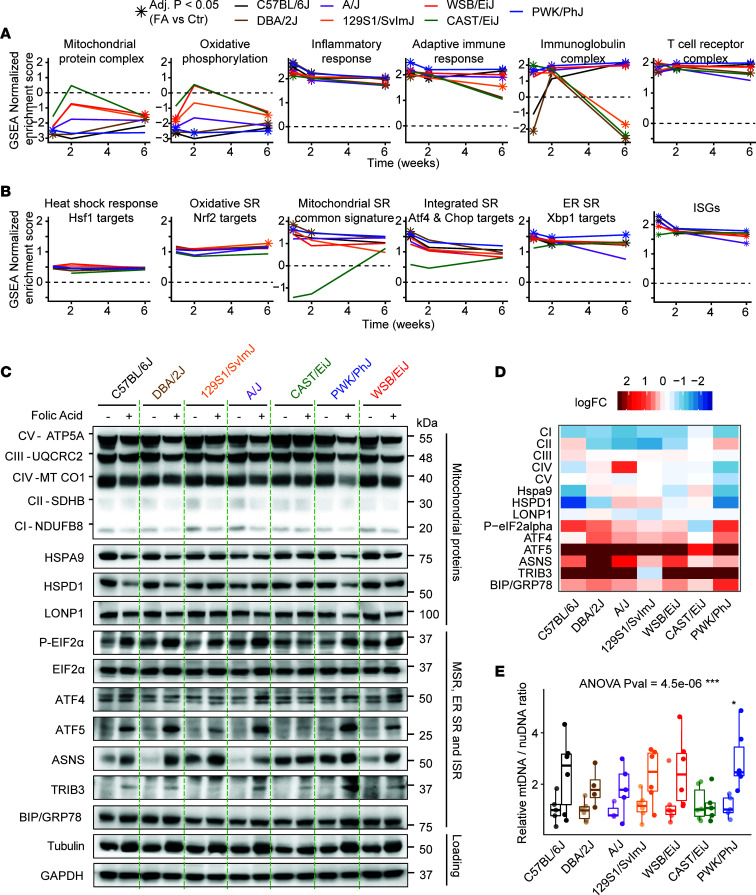
Figure 5. The mitochondrial stress response profile differentiates strains that recover from those that evolve towards chronic disease.
(A) Selected gene set enrichment analysis (GSEA) across strains. Star-shaped dots indicate adjusted P < 0.05 when comparing folic acid to control in a given strain. Compared to other strains, the CAST/EiJ strain loses little mitochondrial activity early and has reduced adaptive immunity later, while the PWK/PhJ strain has strongly repressed mitochondrial activity and later develops persistent T cell– and B cell–mediated adaptive immunity. (B) GSEA of major stress pathways using custom gene sets, constructed as described in Supplemental Table 1. The analysis reveals that heat shock and oxidative stress are not significantly induced at any point, while mitochondrial and ER stress are activated throughout, likely feeding into the integrated stress response. SR, stress response. The CAST/EiJ differs very significantly from every other strain (adjusted P < 0.0001) when it comes to MSR activation at weeks 1 and 2. (C) Western blots from week 1 after folic acid administration and week 2 controls. Mitochondrial respiratory complexes I–V, mitochondrial chaperones, HSPA9, HSPD1, and LONP1; phosphorylation of the central regulator of the integrated stress response, EIF2α, and downstream mediator ATF4; mediators of the MSR, ATF5, ASNS, and TRIB3; and the reporter of ER stress, BIP/GRP78. Tubulin was initially used as a loading control, but it increased upon folic acid administration despite equal amounts of total protein, and GAPDH was used as an alternate loading control. (D) Quantification of the western blot from C. All proteins were normalized to GAPDH, except P-eIF2α, which was normalized to eIF2α, then fold changes between folic acid and control were computed. (E) Measurements of mtDNA/nuclear DNA ratio at week 1 after folic acid administration. The box plot represents median and quartiles. Whiskers reach 1.5 inter-quartile range. ***P < 0.001, **P < 0.01, *P < 0.05, 1-way ANOVA with Tukey post hoc comparisons.

