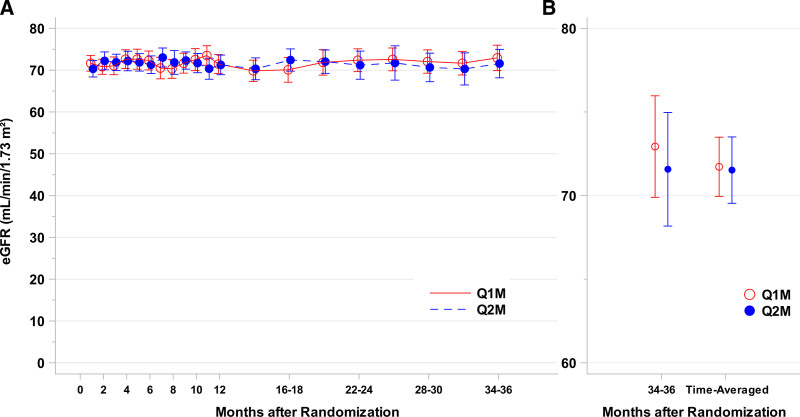
FIGURE 2.
Renal function on q2m belatacept therapy is equal to standard q1m therapy over 3-y follow-up. Longitudinal baseline-adjusted eGFR data for q1m (red) and q2m (blue) are shown in (A). There was no statistically significant difference in eGFR between groups at any time point. B, 36-mo time point and time-averaged mean for q1m and q2m from the baseline-adjusted model. eGFR, estimated glomerular filtration rate; Q1m, every mo dosing; Q2m, every 2-mo dosing of belatacept.

