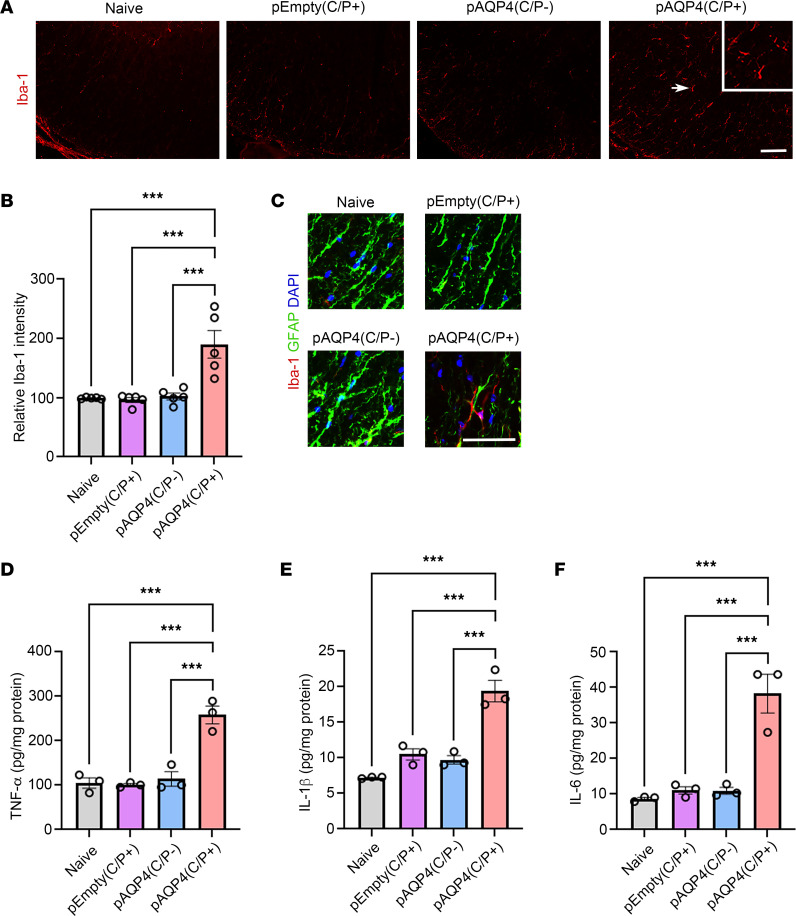
Figure 6. Microglia activation and increase in proinflammatory cytokine levels after AQP4 immunization.
(A) Immunostaining for Iba-1 in the spinal cord of naive, pEmpty(C/P+), pAQP4(C/P–), and pAQP4(C/P+) mice. Scale bar: 50 μm. Original magnification, ×400 (inset). (B) Quantification of Iba-1 immunofluorescence intensity. (C) Coimmunostaining for Iba-1 and GFAP. (D–F) ELISA of TNF-α, IL-1β, and IL-6 levels in the spinal cord homogenate of naive, pEmpty(C/P+), pAQP4(C/P–), and pAQP4(C/P+) mice. Images are representative photomicrographs showing the ventrolateral white matter of cervical spinal cord cross sections from 5 mice per group. Nuclei were counterstained with DAPI. Data are mean ± SEM; n = 5 per group (B), n = 3 per group (D–F). ***P < 0.001, 1-way ANOVA with post hoc Tukey’s test. Scale bar: 50 μm.

