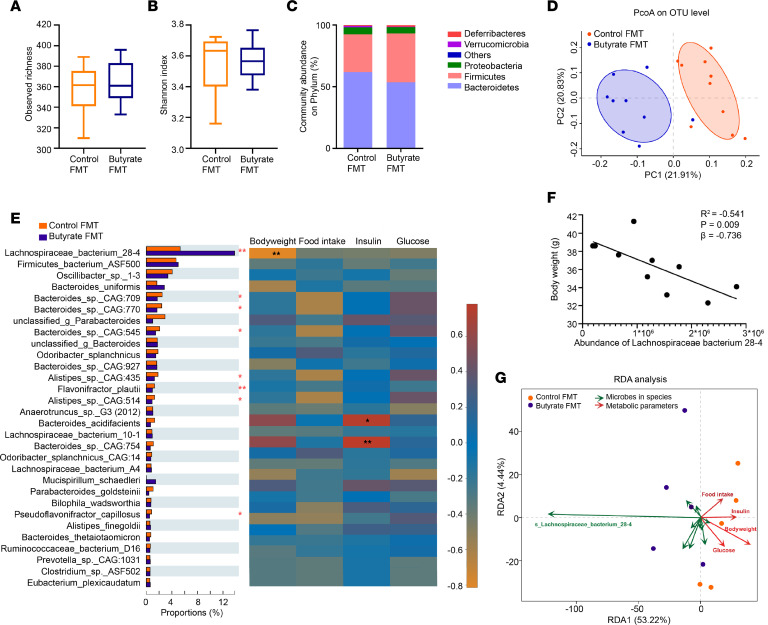
Figure 3. FMT from butyrate-treated lean donor mice selectively enriches Lachnospiraceae bacterium 28-4 in recipient mice.
At the end of the FMT study, the recipients’ bacterial genomic DNA was isolated from the cecum content and sequenced. By 16S rRNA gene analysis, (A) the number of observed species (n = 9–10), (B) Shannon diversity (n = 9–10), and (C) the community abundance of gut microbiota on phylum level (n = 9–10) were assessed. (D) The PCoA plot of unweighted UniFrac distances on OTU levels was then calculated (n = 9–10). (E) By analyzing the metagenomic sequencing data, the abundance of gut microbiota (top 30 based on relative abundance) on species level was compared using Wilcoxon’s rank-sum test and its correlation with metabolic outcomes (BW, food intake, glucose, and insulin) were presented in Spearman’s correlation heatmap (n = 5). (F) Correlation of abundance of Lachnospiraceae bacterium 28-4 with BW was analyzed (n = 5). (G) Correlations of abundance of Lachnospiraceae bacterium 28-4 with metabolic outcomes (BW, food intake, glucose, and insulin) were analyzed using RDA (n = 5). Data are shown as box plot with whiskers at min/max in A and B; statistical significance between 2 groups was determined with 2-tailed Student’s unpaired t test in A and B and Wilcoxon’s rank-sum test in E. *P < 0.05, **P < 0.01; Butyrate vs. Control.

