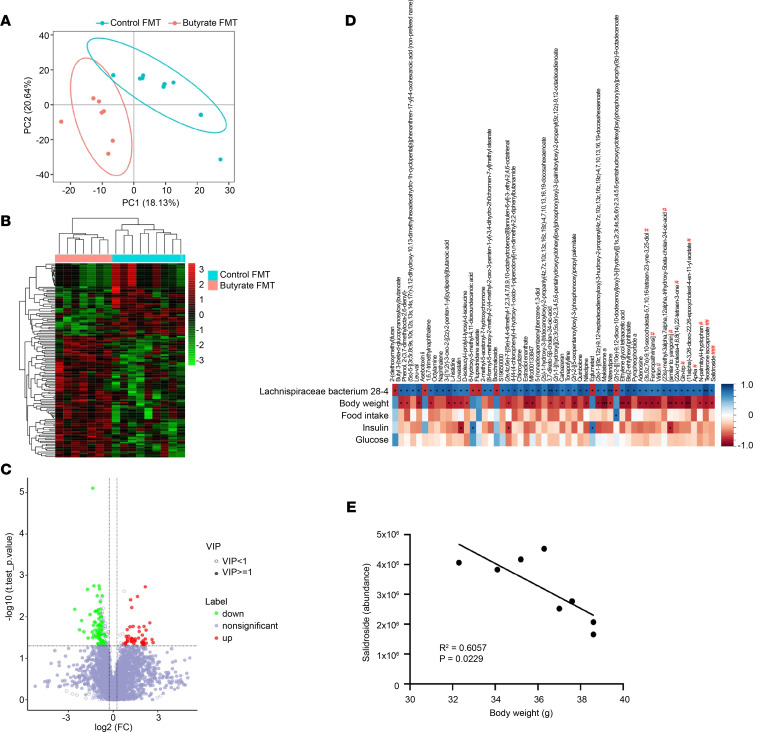
Figure 4. FMT from butyrate-treated lean donor mice alters the gut metabolites in recipient mice.
At the end of the FMT study, the recipients’ cecal content was collected for untargeted metabolomics analysis. The differences in the composition and abundance of metabolites between mice receiving butyrate FMT and control FMT are presented by (A) PCoA, (B) hierarchical cluster analysis, and (C) volcano plots. (D and E) The correlation of abundance of metabolites with the abundance of Lachnospiraceae bacterium 28-4 and metabolic outcomes (including BW, food intake, glucose, and insulin) were presented in Spearman’s correlation heatmap and analyzed. *P < 0.05, **P < 0.01, ***P < 0.001; Butyrate vs. Control. The statistical significance in the abundance of metabolites between mice receiving butyrate FMT and control FMT was determined with 2-tailed Student’s unpaired t test. #P < 0.05, ##P < 0.01, ###P < 0.001. PCoA, principal coordinates analysis; VIP, variable importance in projection.

