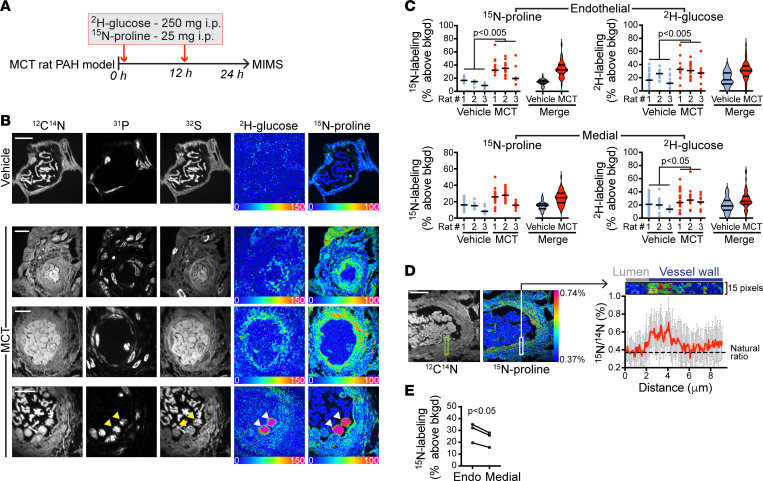
Figure 3. Reprogramming of proline and glucose metabolism in remodeled pulmonary arteries.
(A) Stable isotope labeling protocol. MCT, monocrotaline. (B) MIMS images of pulmonary vessel from control rat (top row) and inflammatory PAH vessels (bottom 3 rows). Stereotypical features of remodeling vessels are evident in 12C14N, 31P, and 32S images, including thickening of the walls and increased cellularity. HSI images demonstrate increased 2H-glucose (2H/1H image) and 15N proline labeling (15N/14N image) in the walls of remodeling vessels. Bottom row, arrowheads indicate 2 intensely labeled nucleated WBCs in the lumen. Scale bars: 10 μm. (C) Dot plots of endothelial (top) and medial cell (bottom) proline (left) and glucose (right) labeling in inflammatory PAH vessels versus control vessels. Data in violin plots are presented as median, IQR. Each dot represents a nucleated cell. P values calculated by the nested ANOVA method. (D) The 15N/14N ratio for pixels of the indicated region of the vessel wall mapped as a function of distance from the origin in the lumen (top). (E) Median endothelial cell labeling relative to median medial cell labeling (n = 3 PAH rats; P values calculated by the Student’s paired 2-tailed t test). Representative images provided in each instance.

