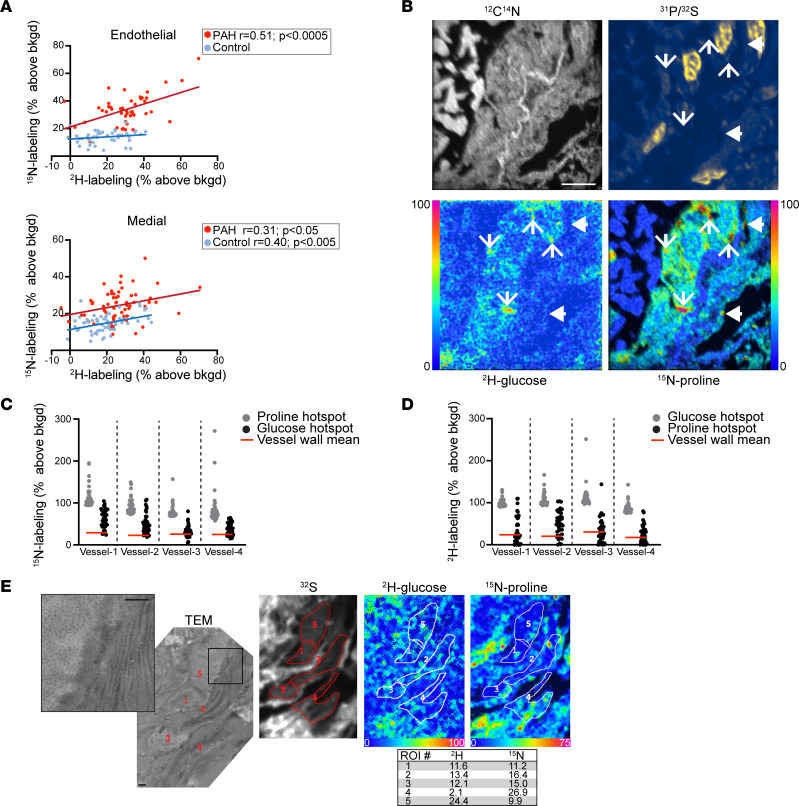
Figure 4. Anabolic convergence of glucose and proline as substrate for biomass in remodeling vessels.
(A) Top: MIMS quantification of proline utilization correlates with glucose utilization in the endothelial cells of inflammatory PAH vessels, but not control vessels. Bottom: MIMS quantification of proline utilization by medial cells correlates with glucose in both PAH and control vessels. Correlations assessed by linear regression model. (B) High-resolution MIMS imaging demonstrates punctate hotspots of hyperutilization of glucose and proline. Line arrows, hyperintense in both glucose and proline; arrowheads, hyperintense in proline but not glucose. Scale bar: 5 μm. (C) 15N-labeling distributions for glucose hotspots (n = top 40), which are largely above the mean for the vessel wall (inclusive of nonhotspots and hotspots) (red line) and partially overlap with the distribution of top 40 15N-proline hotspots (gray). (D) Complementary analysis to C as the 2H-glucose labeling for the top 15N-proline hotspots partially overlaps with the distribution of top 40 2H-glucose hotspots. In C and D, the mean signal for each vessel wall is provided as a reference (red line). Hotspots were 5 × 5 pixels. (E) TEM adjacent to section imaged with MIMS. TEM image inset demonstrates extracellular matrix with collagen fibers arrayed in both cross section (left) and longitudinally (right). ROI were generated to correspond to regions of ECM on the TEM and the data extracted and expressed as a percent above background (table) indicative of glucose and proline labeling. Scale bars: 500 nm.

