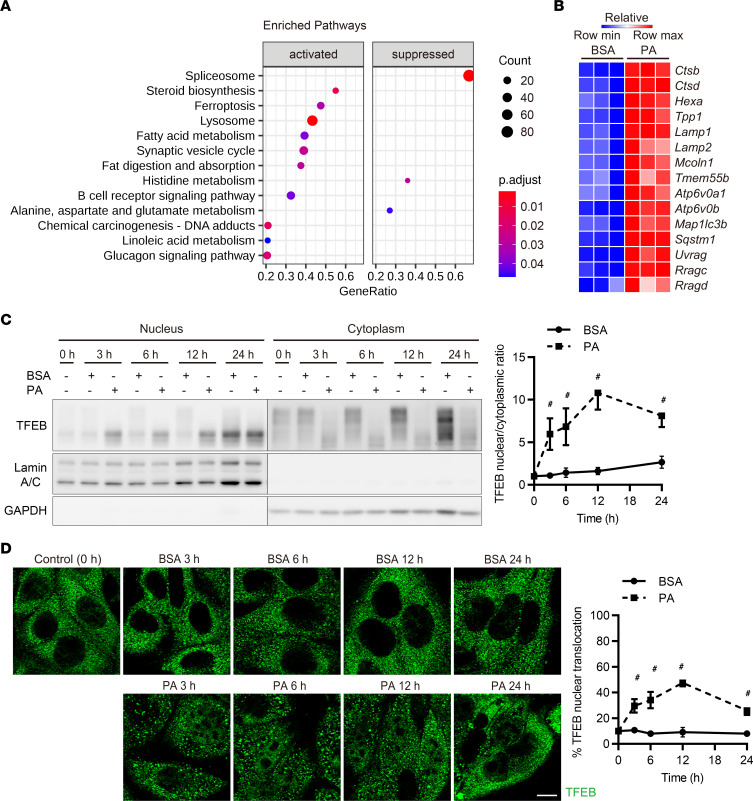
Figure 1. PA activates TFEB in PTECs.
(A and B) We performed RNA-Seq transcriptomic analysis using cultured PTECs treated with either BSA- or PA-bound BSA for 6 hours to identify any significantly enriched pathways (n = 3). (A) Results of GSEA. Dot sizes represent the numbers of genes, while dot colors correspond to the adjusted P value. (B) A heatmap showing the relative expression of target genes. (C) Representative Western blot images of TFEB in nuclear and cytoplasmic fractions of cultured PTECs subjected to BSA or PA treatment for the indicated periods (n = 3). TFEB nuclear/cytoplasmic ratios at the indicated time points are quantified. TFEB nuclear and cytoplasmic levels were normalized for Lamin A/C and GAPDH levels, respectively. The values are normalized by the value at time 0. (D) Representative immunofluorescence images of TFEB in cultured PTECs subjected to BSA or PA treatment for the indicated periods (n = 3). The percentages of PTECs exhibiting TFEB nuclear translocation at the indicated time points are presented. Bars: 10 μm (D). Data are provided as means ± SEM. Statistically significant differences: #P < 0.05 versus BSA-treated PTECs (C and D, 2-tailed Student’s t test).

