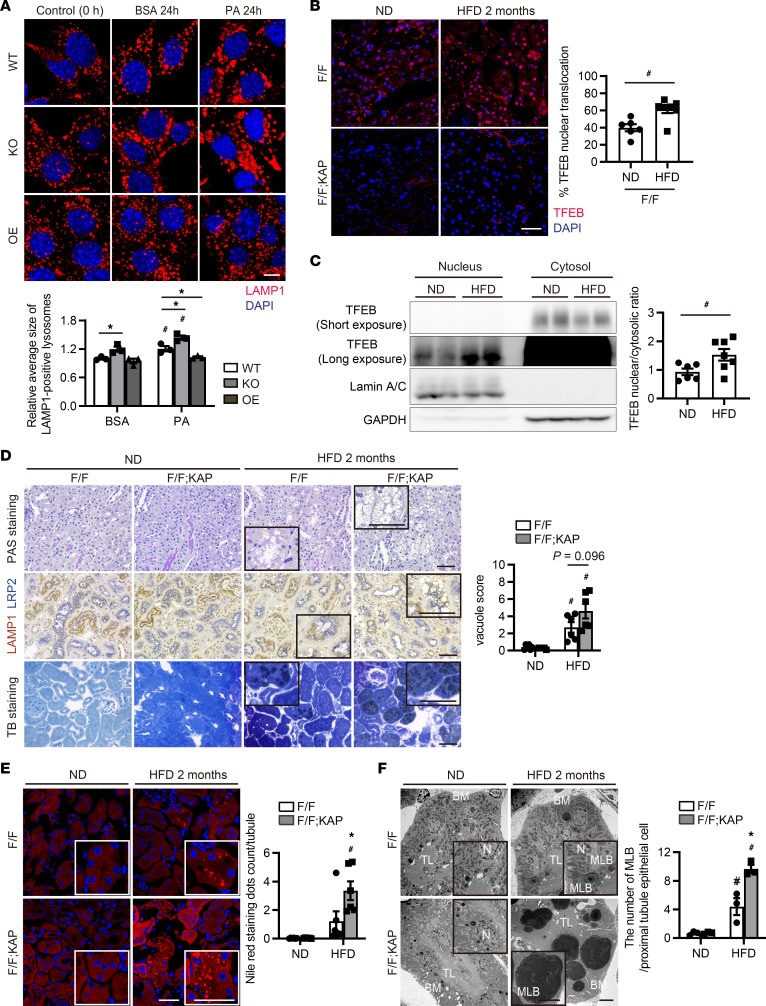
Figure 3. TFEB alleviates phospholipid accumulation in enlarged lysosomes during lipid overload in PTECs.
(A) Immunofluorescence images of LAMP1 after BSA or PA treatment for 24 hours (n = 3). (B–F) To investigate the role of TFEB in the kidneys under lipid overload, 8-week-old Tfebfl/fl KAP and Tfebfl/fl control mice were fed an ND or HFD for 2 months. (B) Immunostaining images showing TFEB in the kidney cortical regions (n = 6–7). The percentage of PTECs exhibiting TFEB nuclear translocation was determined. (C) Western blot images of TFEB in nuclear and cytosolic fractions of kidneys (n = 6–7). TFEB nuclear/cytosolic ratios are shown. Nuclear and cytosolic TFEB levels were normalized for Lamin A/C and GAPDH levels, respectively. (D and E) Images of PAS staining, LAMP1 immunostaining, toluidine blue staining (D), and Nile red staining (E) in the kidney cortical regions (n = 5–6). Sections were immunostained for LRP2, a marker of proximal tubules (blue) (D) and counterstained with hematoxylin (bluish purple) (D) and DAPI (E). (D) Vacuole scores are shown. (E) The number (per proximal tubule) of Nile red–positive dots was counted. (E) Images of electron micrographs of the kidneys. The number of MLBs was counted (n = 3). Bars: 10 μm (A), 40 μm (B and E), 50 μm (D), and 5 μm (F). Values represent means ± SEM. Statistically significant differences: *P < 0.05 versus treatment-matched Tfebfl/fl control littermates or wild-type PTECs; #P < 0.05 versus nonobese mice or BSA-treated PTECs (A, 1-way ANOVA followed by Dunnett’s test; D–F, 1-way ANOVA followed by Tukey-Kramer test; B and C, 2-tailed Student’s t test). All images are representative of multiple experiments. WT, wild-type PTECs; KO, Tfeb-deficient PTECs; OE, Tfeb-overexpressing PTECs; BM, basement membrane; MLB, multilamellar body; TL, tubular lumen; N, nucleus; F/F, Tfebfl/fl mice; F/F;KAP, Tfebfl/fl KAP mice; PAS, periodic acid–Schiff; TB, toluidine blue.

