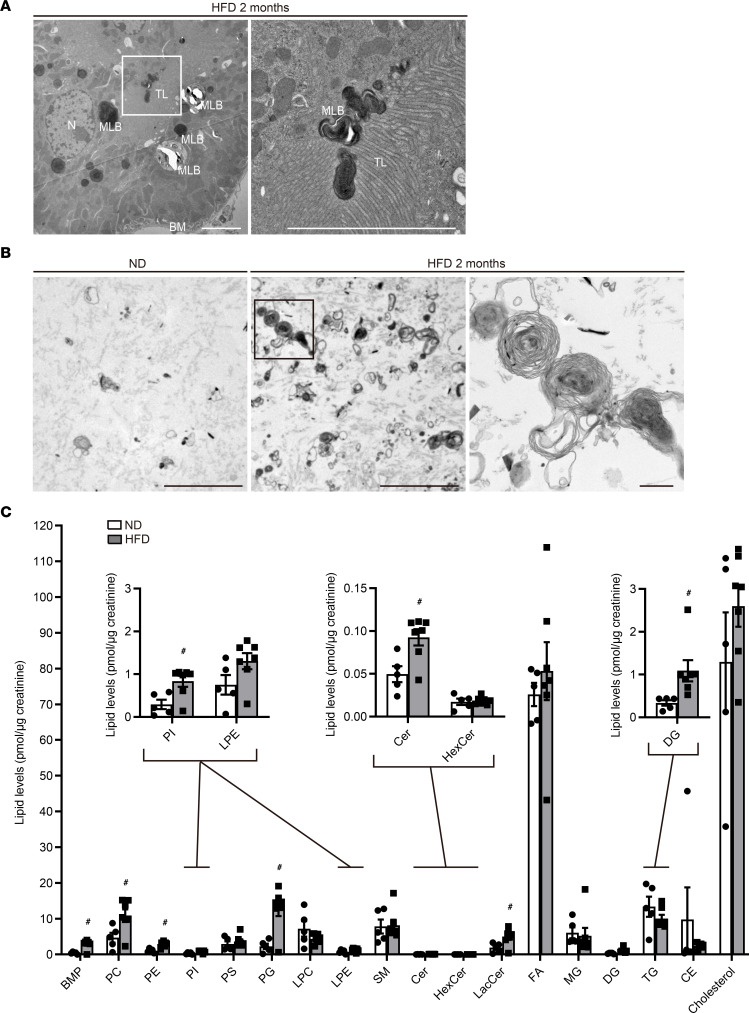
Figure 5. MLBs are released from the apical membrane of PTECs into the tubular lumen in obese mice.
(A and B) Representative electron micrographs of the kidneys (A) and the urine pellets (B) of nonobese and obese Tfebfl/fl mice (n = 2–3). (C) Urinary lipidomics of nonobese and obese mice (n = 5 or 7). Data are presented as the total amount of each lipid species normalized to urine creatinine concentration. Bars: 5 μm (A and B) and 500 nm (B, magnified image). Values represent means ± SEM. Statistically significant differences: #P < 0.05 versus nonobese mice (C, 2-tailed Student’s t test). BM, basement membrane; MLB, multilamellar body; TL, tubular lumen; N, nucleus; BMP, bis(monoacylglycerol) phosphate; PC, phosphatidylcholine; PE, phosphatidylethanolamine; PI, phosphatidylinositol; PS, phosphatidylserine; PG, phosphatidylglycerol; LPC, lysophosphatidylcholine; LPE, lysophosphatidylethanolamine; SM, sphingomyelin; Cer, ceramide; HexCer, hexose ceramide; LacCer, lactosylceramide; FA, fatty acid; MG, monoacylglycerol; DG, diacylglycerol; TG, triacylglycerol; CE, cholesterylester.

