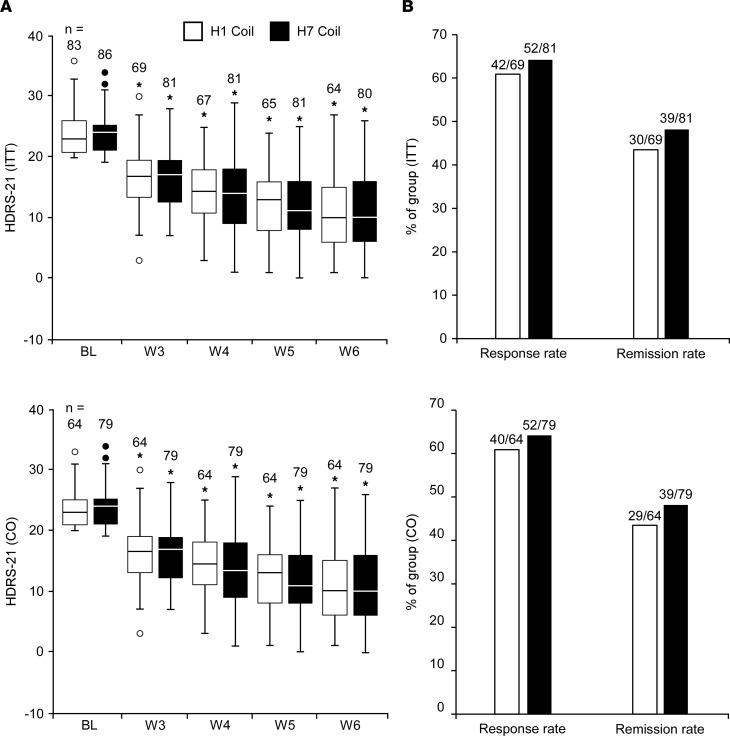
Figure 2. Response to treatment.
Box-and-whisker plots for changes in HDRS-21 scores over the treatment course (A) and percentage of patients who experienced response (≥50% reduction from baseline in HDRS-21 score) and remission (HDRS-21 < 10) at the week 6 visit (B). Repeated measures ANCOVA models indicated that starting at the first measurement following treatment initiation (week 3), HDRS-21 scores were significantly reduced from baseline in both groups. No differences were observed between groups at any time point. The box plots depict the minimum value, first quartile, median, third quartile, and maximum value. The length of the box represents the interquartile range and dots represent outliers. *P < 0.0001, a repeated measures ANCOVA coefficient test for the change from baseline scores of that group. BL, baseline; W, week.

