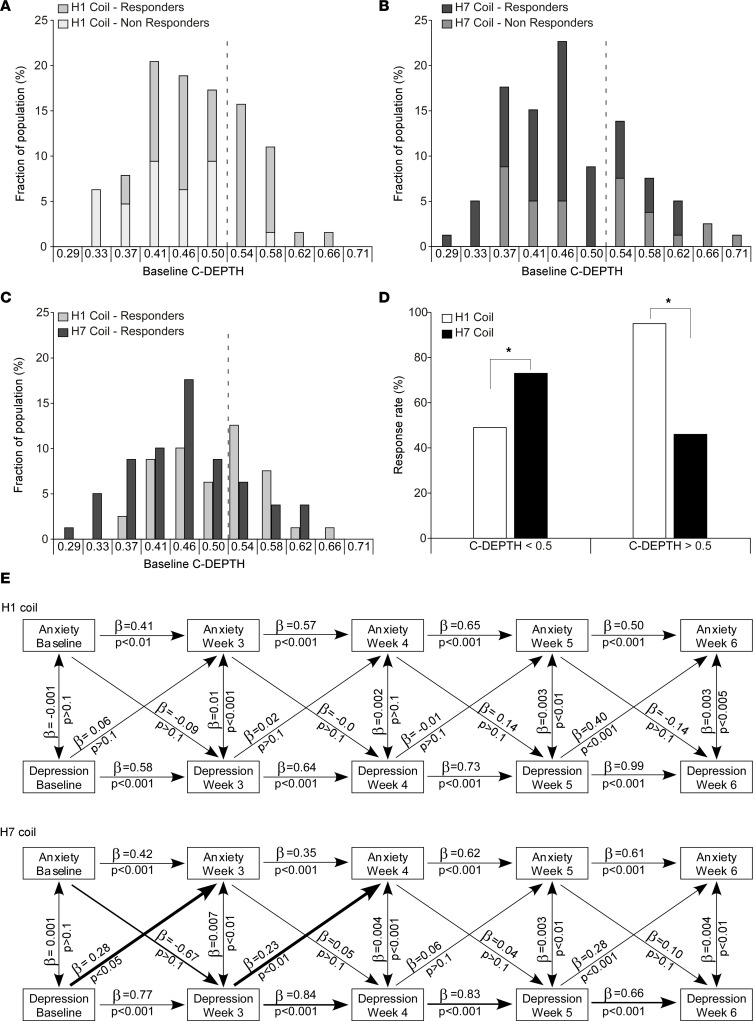
Figure 3. Baseline C-DEPTH and clinical response.
Histograms of C-DEPTH for patients who received H1 coil stimulation (A) and H7 coil stimulation (B) grouped into responders and nonresponders. (C) Histogram of C-DEPTH scores for patients with clinical response. (D) Response rate in patients with C-DEPTH scores above or below the 0.5 cutoff value. *P < 0.05 following a χ2 test. Response rates significantly differ between treatments both below (χ21, N = 101 = 6.3, P = 0.01) and above (χ21, N = 43 = 11.5, P = 0.0068). (E) Cross-lagged regression analysis for the anxiety and depression subscales of the C-DEPTH over the course of the treatment (n = 144). The cross-lagged regression analysis was performed in R, version 3.6.1, using the lavaan package. Wide arrows represent statistically significant cross-lagged waves that differ between groups.

