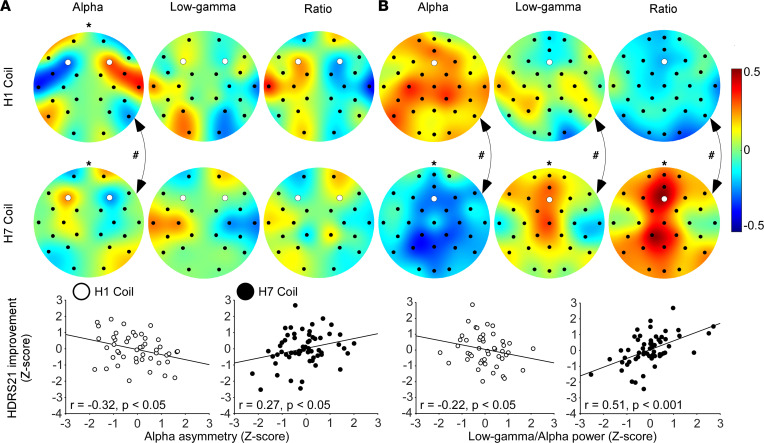
Figure 4. Correlation between clinical improvement and brain activity during the first treatment.
(A) Topographical plots of the correlation between improvement in HDRS-21 score and brain asymmetry in the alpha band, low-gamma band, and low-gamma/alpha ratio and scatterplots of left alpha band asymmetry over the LPFC (electrodes F3 and F4, marked white. H1: n = 48; H7: n = 59). (B) Topographical plots of the correlation between absolute brain activity and improvement in HDRS-21 score and scatterplots of the power ratio over the MPFC (electrode Fz; marked white. H1: n = 48; H7: n = 58). Panel arrangement is similar to A. * represents significant linear correlation test, and # represents significant Fisher’s Z test for differences in correlation magnitude between H1 and H7 coils.

