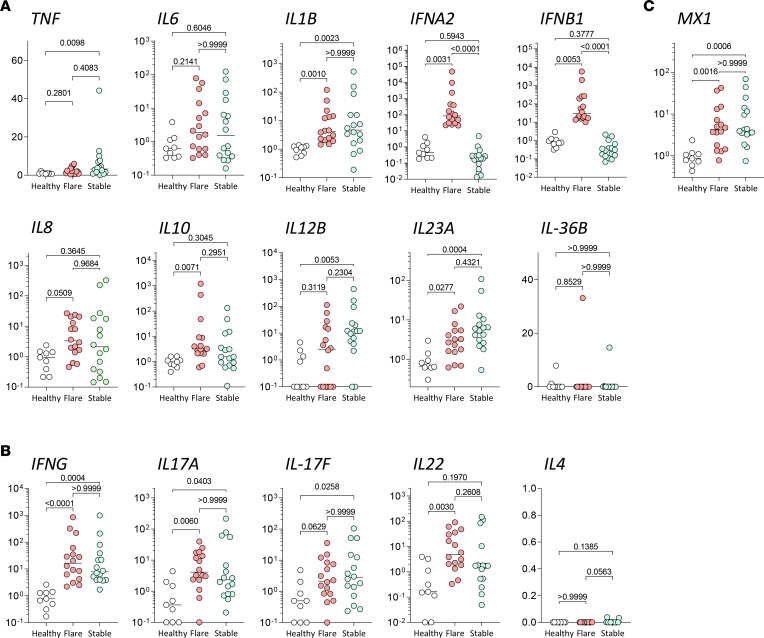
Figure 1. Inflammatory cytokine profile in acute flare-ups and stabilized lesions of rosacea.
(A and B) Gene expression of innate and adaptive inflammatory genes from acute flare-ups (red, n = 16) and stabilized lesions (green, n = 16) as compared with healthy skin (white, n = 9). (C) MX1 expression comparison between healthy skin, flare-ups, and stabilized lesions. Multiplicity adjusted P values of 1-way ANOVA with Dunn’s multiple-comparison test are depicted.

