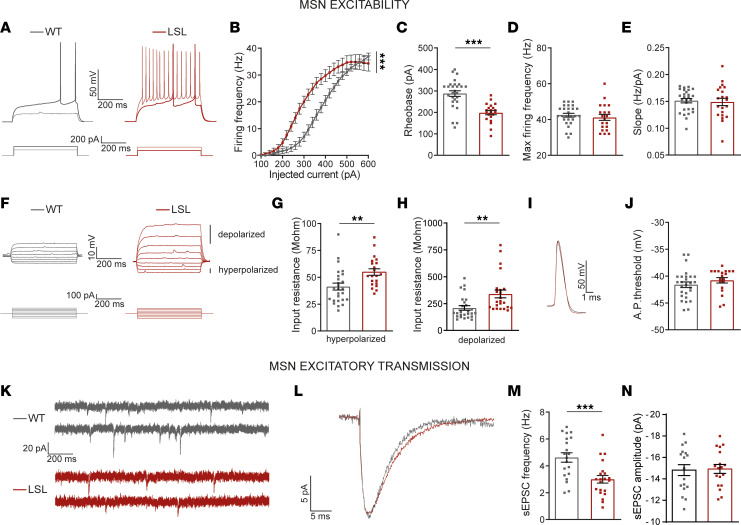
Figure 1. Absence of UBE3A generates increased firing rates and decreased excitatory transmission in MSNs from mature DMS.
(A) Representative firing pattern of MSNs (top) obtained with current injection (bottom); thick traces represent the response to rheobase current. (B) F-I curves, 1-way repeated measures (RM) ANOVA (F1,49 = 7.90, P = 0.0005). (C) Rheobase, 2-tailed unpaired t test (t = 5.17 df = 47, P = 0.0001). (D) Maximum firing rate, 2-tailed unpaired t test (t = 0.66 df = 47, P = 0.52). (E) F-I slope, 2-tailed unpaired t test (t = 0.33 df = 47, P = 0.75). (F) Representative voltage responses of MSNs (top), obtained by 30 pA current increments between –100 pA and +140 pA (bottom). (G) Input resistance at hyperpolarized domain, 2-tailed unpaired t test (t = 3.16 df = 47, P = 0.0028). (H) Input resistance at depolarized domain, 2-tailed unpaired t test (t = 3.03 df = 47 P = 0.0041). (I) Examples of single AP. (J) AP threshold, 2-tailed unpaired t test (t = 1.12 df = 47, P = 0.26). (K) Representative recordings of sEPSCs from MSNs. (L) Representative average sEPSCs. (M) sEPSC frequency, 2-tailed unpaired t test (t = 3.63 df = 39, P = 0.0008). (N) sEPSC amplitude, 2-tailed unpaired t test (t = 0.17 df = 39, P = 0.87). Sample size (N = neurons/mice) for B–E and G–J: WT: N = 27/7; LSL: N = 21/5 and for M and N: WT: N = 20/7; LSL: N = 21/5. Data represented as dot plots (1 neuron) with mean ± SEM. **P ≤ 0.01, ***P ≤ 0.001. See also Supplemental Table 1.

