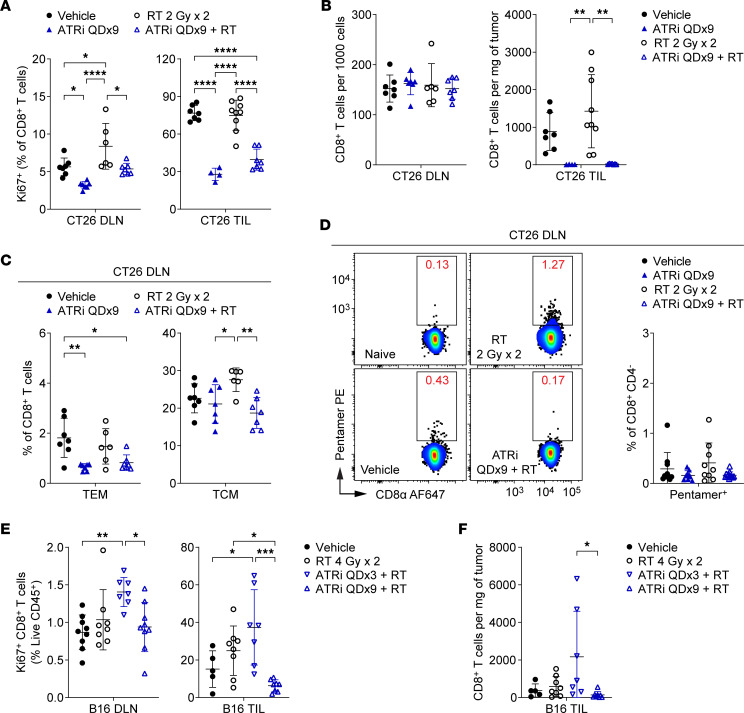
Figure 7. Prolonged daily ATRi treatment abolishes the adaptive CD8+ T cell response following RT.
(A–D) CT26 tumor–bearing mice were treated with ATRi on days 1–9 (ATRi QDx9), RT 2 Gy x 2 (days 1–2), ATRi QDx9 + RT, or vehicle, and immunoprofiled at day 9, 1 hour after the final dose of ATRi. (A) Quantitation of proliferating (Ki67+) CD8+ T cells, as percentages of CD8+ T cells, in DLN and TILs. (B) Quantitation of CD8+ T cells in DLN (per 1,000 cells) and TILs (per milligram of tumor). (C) Quantitation of CD8+ Tem and Tcm cells, as percentages of CD8+ T cells, in DLN. (A–C) Data from 2 independent experiments (1 for ATRi QDx9 TIL) with 2–5 mice per group. n = 7 Vehicle, 7 ATRi QDx9 DLN (4 TIL), 9 RT TIL (6 DLN), 7 ATRi QDx9 + RT. (D) Representative cytograms and quantitation of Pentamer+ CD8+ T cells, as percentages of CD8+CD4– cells, in DLN. Data from 5 independent experiments with 1–4 mice per group. n = 10 Vehicle, 9 ATRi QDx9, 9 RT, 12 ATRi QDx9 + RT. (E and F) B16 tumor–bearing mice were treated with RT 4 Gy x 2 (days 1–2), ATRi QDx3 + RT, ATRi QDx9 + RT, or vehicle, and immunoprofiled at day 9 (1 hour after the final dose of ATRi QDx9). (E) Quantitation of proliferating (Ki67+) CD8+ T cells, as percentages of live, CD45+ immune cells, in DLN and TILs. (F) Quantitation of CD8+ T cells, per milligram of tumor, in TILs. (E and F) Data from 2 independent experiments with 2–6 mice per group. n = 9 Vehicle DLN (5 TIL), 8 RT, 7 ATRi QDx3 + RT, 9 ATRi QDx9 + RT DLN (8 TIL). (A–F) Mean and SD bars shown. *P < 0.05, **P < 0.01, ***P < 0.001, ****P < 0.0001 by ANOVA with Tukey’s multiple-comparison test.

