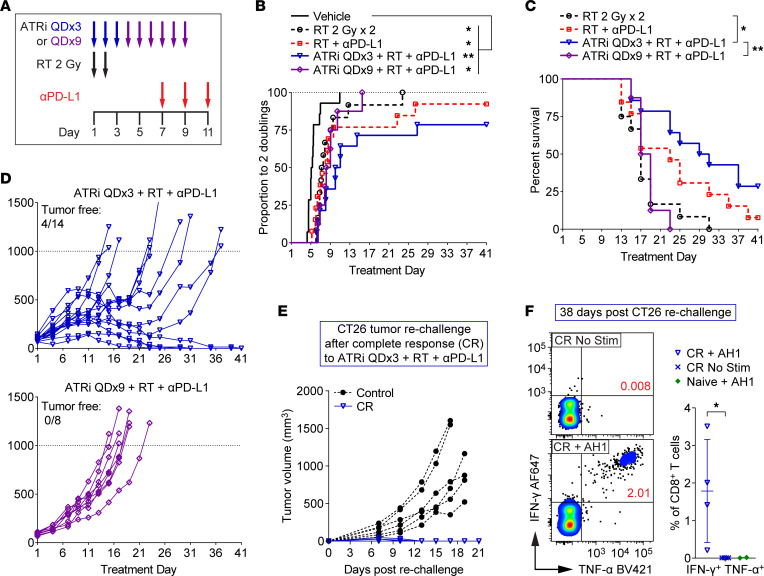
Figure 8. ATRi cessation is necessary for extended survival and complete responses after treatment with ATRi and sequential RT plus PD-L1 blockade.
(A) Schema for CT26 tumor–bearing mice treated with RT 2 Gy x 2 (days 1–2), RT + anti–PD-L1 (αPD-L1; days 7, 9, 11), ATRi QDx3 + RT + αPD-L1, ATRi QDx9 + RT + αPD-L1, or vehicle. (B) Proportions of mice that reached 2 tumor volume doublings, plotted over time. *P < 0.05, **P < 0.01 by log-rank test with Holm-Šidák adjustment for multiple comparisons (all groups). (C) Survival curves for non-vehicle groups. The survival endpoint was when tumor volume exceeded 1,000 mm3. *P < 0.05, **P < 0.01 by log-rank test with Holm-Šidák adjustment for multiple comparisons (non-vehicle groups). (D) Individual tumor growth curves for the ATRi QDx3 + RT + αPD-L1 and ATRi QDx9 + RT + αPD-L1 groups. The numbers of tumor-free mice (complete responders) are noted. (A–D) Data from 2 independent experiments with 5–8 mice per group (1 experiment for ATRi QDx9 + RT + αPD-L1). n = 14 Vehicle, 12 RT, 13 RT + αPD-L1, 14 ATRi QDx3 + RT + αPD-L1, and 8 ATRi QDx9 + RT + αPD-L1. (E) Individual tumor growth curves for ATRi QDx3 + RT + αPD-L1 complete responders (CR, n = 4) rechallenged with CT26 and for control mice (n = 6) challenged with CT26 for the first time. (F) Representative cytograms and quantitation of IFN-γ+TNF-α+ CD8+ T cells in AH1 peptide–stimulated (CR + AH1, n = 4) versus unstimulated (CR No Stim, n = 4) splenocytes from CR mice and AH1 peptide–stimulated splenocytes from tumor-naive mice (Naive + AH1, n = 2). *P > 0.05 by 2-tailed, unpaired t test. Naive + AH1 controls were not included in the statistical analysis.

