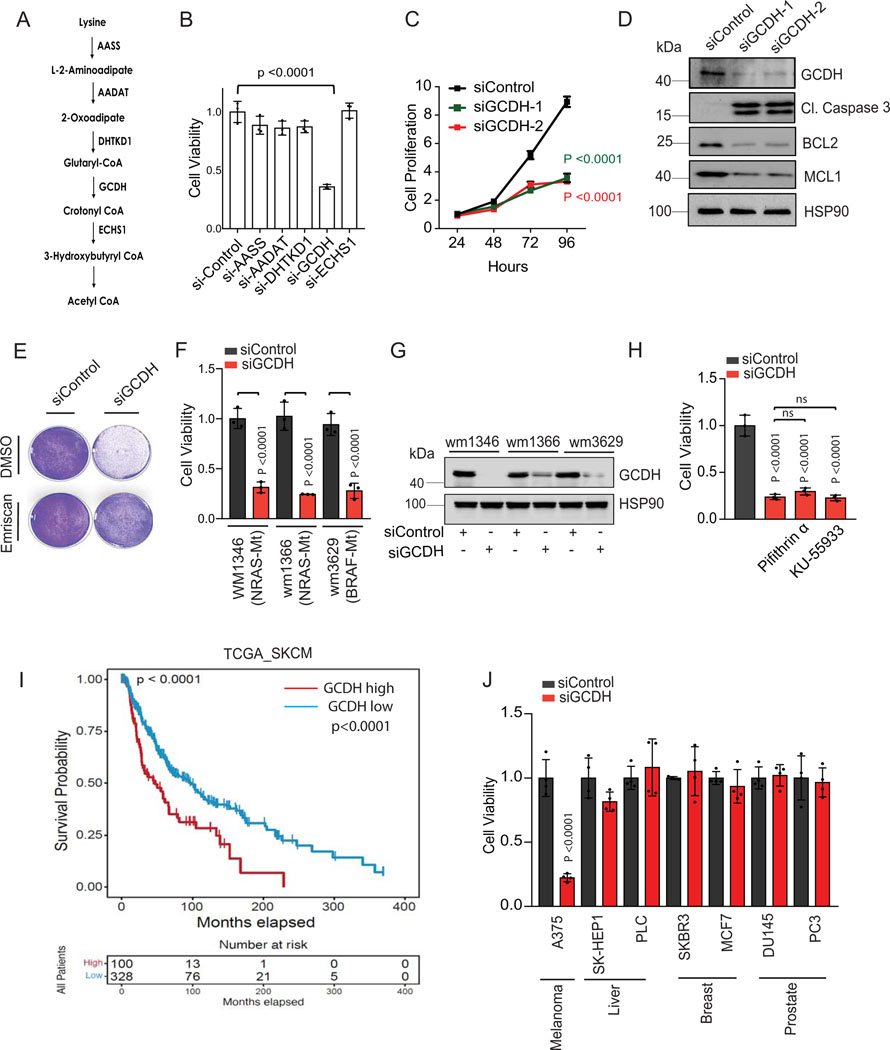
Figure 1. GCDH is required for melanoma cell survival.
(A) Schematic representation of enzymes functioning in the lysine catabolic pathway. (B) A375 melanoma cells were transfected 96 hr with siRNAs targeting AASS, AADAT, DHTKD1, GCDH, ECHS1 or control sequence using Jetprime. Cell viability was then measured by quantifying crystal violet staining. (C) Growth of A375 cells upon GCDH KD with two independent siRNAs assessed over a 24–96 hr period post transfection. Growth was analyzed by cell counting at indicated time points. (D) A375 cells were transfected with siRNA against GCDH, and western blot analysis performed with indicated antibodies. (E) Cell viability assay of control or GCDH KD A375 cells treated with the caspase inhibitor Emriscan (10μM for 48 hr). (F) Cell viability assay of indicated cells 96 hr after transfection with siRNAs targeting GCDH. Cell viability was measured by quantifying crystal violet staining. (G) Western blot analysis confirming GCDH KD as described in D. (H) Analysis of A375 cell viability upon GCDH KD alone or combined with treatment with Pifithrin-α or KU-55933. (I) Comparison of patient survival based on analysis of GCDH expression in melanoma patients using TCGA (p value 7.100673e-5). Total number (n) of patients = 428; n (GCDH high) =328 and n (GCDH low) =100. (J) Cell viability was measured by quantifying crystal violet staining upon GCDH KD in indicated cancer lines. Data are representative of three experiments (D and G) and presented as mean values ± SD of n = 3 for (B, C, F, H) and n=4 for (J) independent experiments. Statistical significance (indicated p-value or ns- not significant (w.r.t si-Control) was calculated using one-way ANOVA for (B, F, H, and J) and two-way ANOVA for (C). Each p value is adjusted to account for multiple comparisons. P values in figures correspond to the comparison between siControl and siGCDH. The survival curves and p-values were computed using survfit function in R survival package (Kaplan-Meier survival curve and two-sided log rank test with no adjustments for multiple comparisons) for (I). Statistics source data for Figure 1 can be found in Source data files - Figure 1 and uncropped scans of all blots and gels for figure 1 can be found in Source data files for blot- Figure 1.

