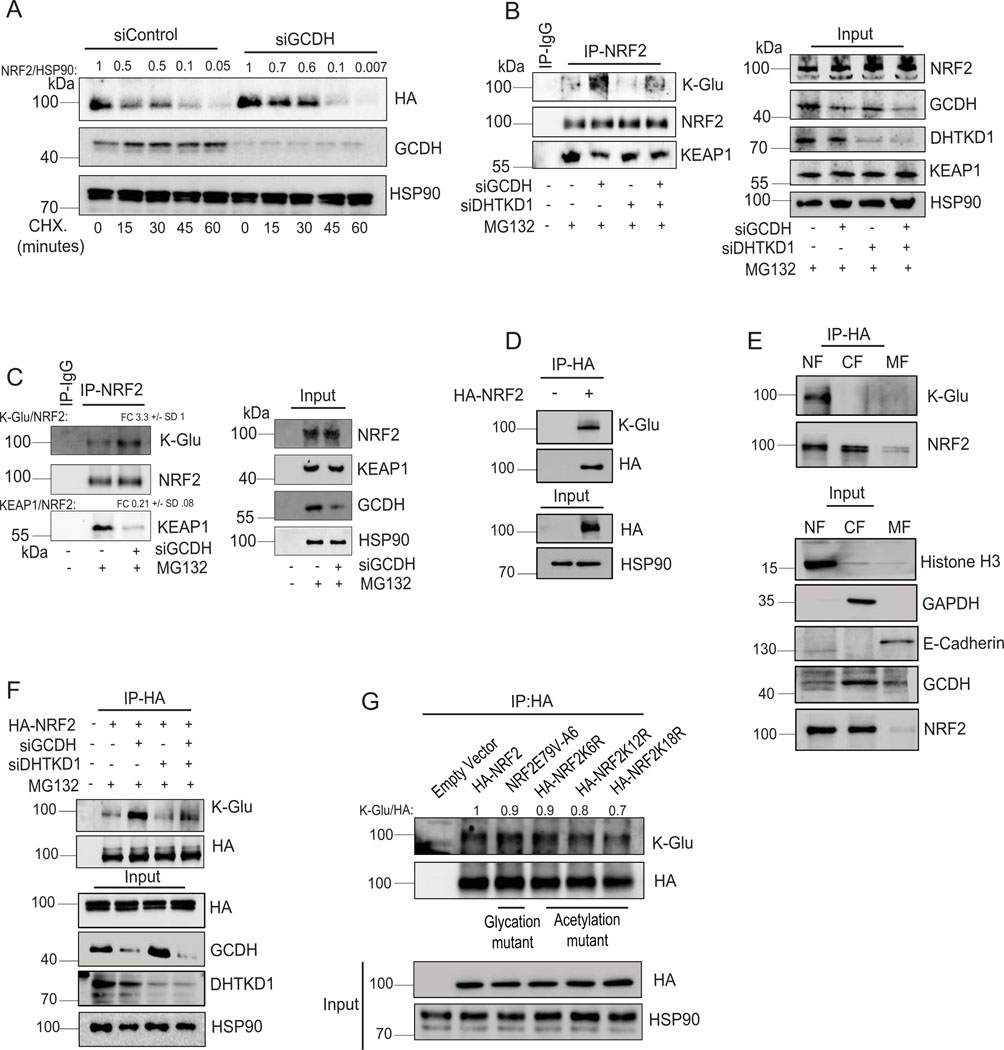
Extended Data Fig. 6.
Lysine glutarylation antagonizes KEAP1 binding, increasing NRF2 stability (A) Cycloheximide (CHX) chase analysis of HA-NRF2 stability in control and GCDH KD HEK-293T cells ectopically expressing HA-NRF2. HEK293T cells were transfected for 72 hr with indicated constructs and treated with 50 μM Cycloheximide (CHX) for different time periods, followed by western blotting with indicated antibodies. After quantification, signals obtained were used to calculate HA-NRF2/HSP90 ratios and described as fold change relative to CHX treatment time = 0. (B) Immunoprecipitation and Western blot analysis of A375 transfected with indicated constructs. Cells were treated with the proteasomal inhibitor MG132 for 4 hr, followed by IP/Western blotting analysis with antibodies to detect K-Glu PTM, KEAP1, and NRF2. (C) Immunoprecipitation and Western blot analysis of UACC903 cells transfected with indicated constructs as described in (B). (D) HEK293T cells were transfected with HA-NRF2 for 72 hr, and NRF2 glutarylation was measured in HA-NRF2 pull-downs fractions using HA-binding beads. (E) Enrichment of NRF2 glutarylation in nuclear fractions was measured in HA-NRF2 pull-downs from HEK293T cells transfected with HA-NRF2 after an initial cell fractionation step to isolate membrane (MF), cytoplasmic (CF), and nuclear (NF) fractions. Successful fractionation was confirmed by immunoblotting with indicated markers: MF (E-cadherin), CF (GAPDH), and NF (Histone H3). (F) HEK293T cells transfected with indicated constructs and IP of indicated HA-NRF2 mutants using HA-affinity beads were performed, followed by Western blot analysis using K-Glu and HA-tag antibodies. (G) HEK293T cells were transfected with indicated constructs and IP of various HA-NRF2 mutants using HA-affinity beads, followed by Western blot analysis using K-Glu and HA-tag antibodies. After quantification, signals obtained were used to calculate K-Glu/HA-NRF2 ratios and described as fold change relative to HA-NRF2 control. After quantification, signals obtained in panels C for 3 independent experiments were used to calculate the ratio of the indicated protein relative to NRF2 levels in IP samples, described as fold change (FD) +/−SD for indicated proteins. Data are representative of three experiments. Statistics source data for Extended data figure 6 can be found in Source data files - Extended data figure 6 and uncropped scans of all blots and gels for Extended data figure 6 can be found in Source data files for blots - Extended figure 6.

