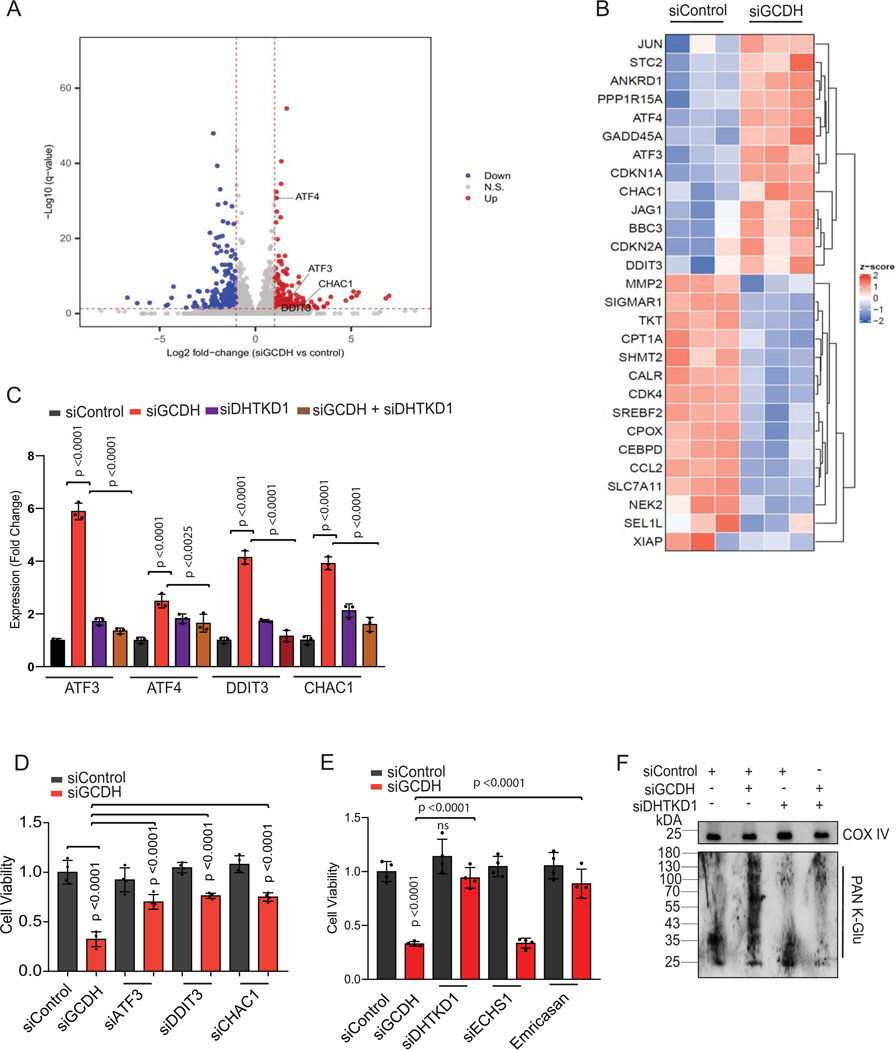
Figure 2. GCDH inhibition promotes DHTKD1-dependent cell death.
(A) Volcano plot showing elevated expression of ATF4-ATF3 targets controlling the DHTKD1-mediated cell death cascade (ATF3, ATF4, DDIT3, and CHAC1), as identified by RNA-seq analysis. (B) Heatmap showing differential expression of ATF3/4 downstream targets in GCDH KD A375 cells, as identified by RNA-seq analysis. (C) RT-qPCR validation of ATF3, ATF4, DDIT3, and CHAC1 in A375 cells transfected with indicated siRNAs. (D and E) Viability of A375 cells transfected for 96 hr with indicated siRNAs. Viability was analyzed by crystal violet staining. (F) Western blot analysis of mitochondrial extracts from A375 cells using PAN K-Glu antibody to detect lysine glutarylation 72 hr after transfection with indicated siRNAs. COX IV was used as a loading control. Data are representative of three experiments for (F) and presented as the mean values ± SD of n = 3 for (C) and n=4 for (D and E). Statistical significance (indicated p-value or ns- not significant w.r.t control) was calculated using one-way ANOVA for (C, D, and E). Each p value is adjusted to account for multiple comparisons. Statistics source data for Figure 2 can be found in Source data files - Figure 2 and uncropped scans of all blots and gels for figure 2 can be found in Source data files for blot- Figure 2.

