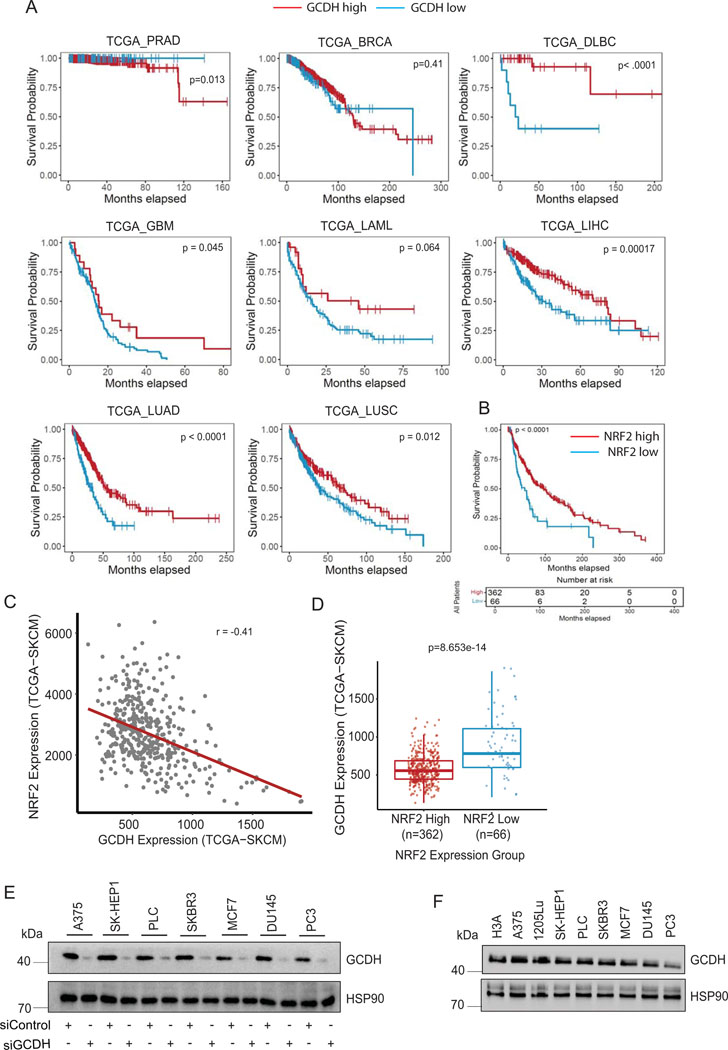
Extended Data Fig. 2.
GCDH expression correlates with melanoma patients outcome (A) Survival correlation analysis of GCDH expression in various cancer subtypes (prostate adenocarcinoma (PRAD), breast cancer (BRCA), diffuse large B-cell lymphoma (DLBC), glioblastoma (GBM), acute myeloid leukemia (LAML), liver hepatocellular carcinoma (LIHC), lung adenocarcinoma (LUAD), and lung squamous cell carcinoma (LUSC), using TCGA. (B) Comparison of patient survival based on analysis of NRF2 expression in melanoma patients using TCGA. Total number (n) of patients = 428; n (NRF2 high) =362 and n (NRF2 low) =66. (C) Scatterplot depicting a comparison of GCDH and NRF2 expression levels in TCGA-SKCM (melanoma) patient cohort. GCDH and NRF2 expressions are anti-correlated (Spearman correlation coefficient = −0.41). (D) Boxplots depicting GCDH expression in NRF2 high (n=362) and NRF2 low (n=66) patient samples stratified according to survival analysis of TCGA-SKCM patient cohort based on NRF2 expression (refer to NRF2 survival analysis in (B). The difference in expression of GCDH between NRF2 high and low groups is statistically significant (p-value = 8.653e-14, calculated using two-sided Wilcoxon Rank Sum test). NRF2 low group minimum = 242.2, maximum = 1907, median = 815.6, 1st quartile (25th percentile) = 633 and 3rd quartile (75th percentile) = 1142.5. NRF2 high group minimum = 132.8, maximum =1242.4, median =556.4, 1st quartile (25th percentile) = 446 and 3rd quartile (75th percentile) = 686.6. (E) Various cancer cells were transfected with siRNAs targeting GCDH or with a control sequence for 72 hr, and then lysates were subjected to confirm GCDH-KD. (F) GCDH expression was compared among various cancer cells and immortalized H3A cells. HSP90 was used as a loading control. Data are representative of three experiments. Uncropped scans of all blots and gels for Extended data figure 2 can be found in Source data files for blots - Extended figure 2.

