
Fig. 5.
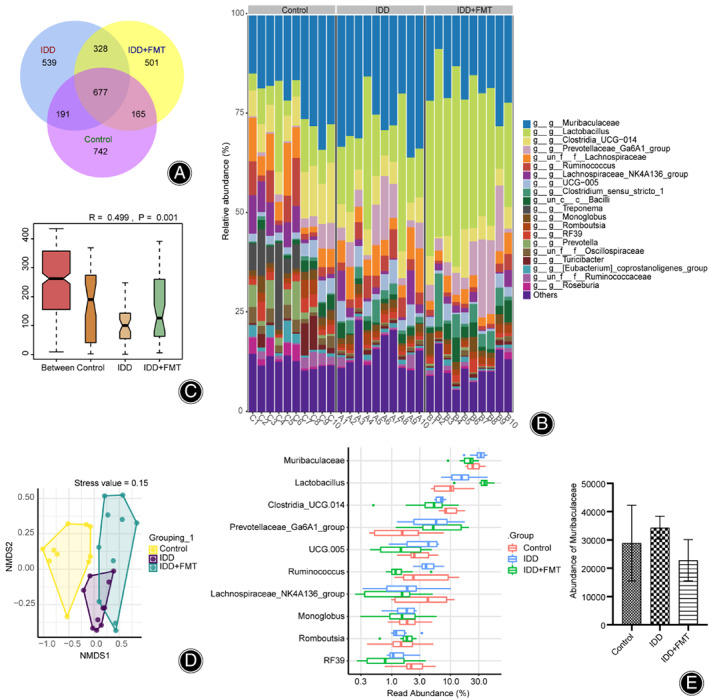
Changes in gut microbiota after FMT. (A) Venn diagram. The number on the petal represents the number of ASVs unique to the sample. (B) Histogram of the relative abundance of top 20 ASVs at the genus level. (C) Anosim analyses. This was used to analyze differences between groups. (D) NMDS index shows the differences between groups. E. Read abundance of top 10 dominant flora at the genus level. FMT, fecal microbiota transplantation; ASV, amplicon sequence variant; NMDS, non‐metric multidimensional analysis.