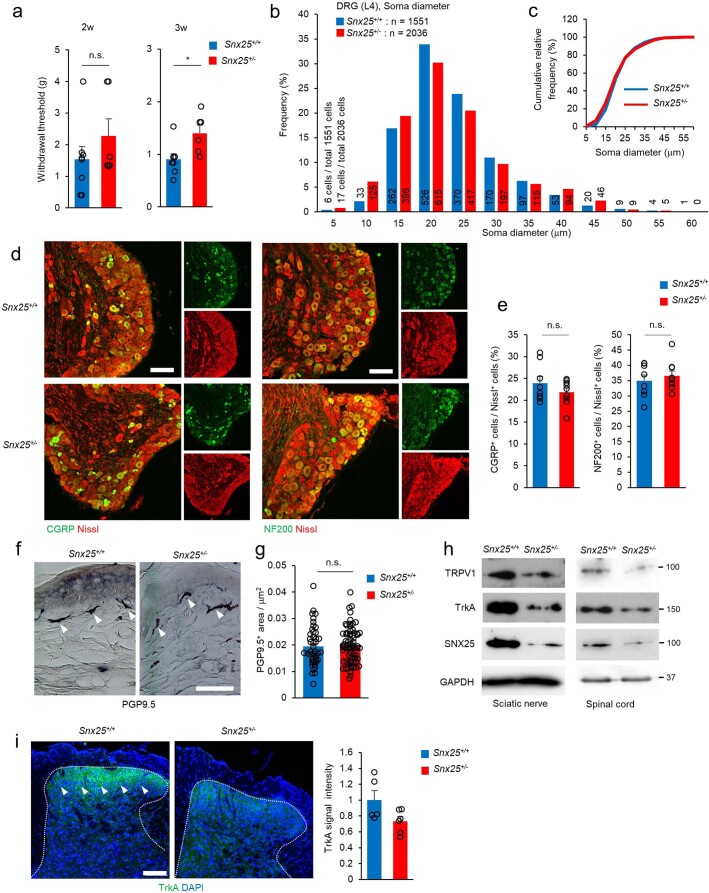
Extended Data Fig. 3. Snx25+/− mice develop normally.
(a) VF thresholds of young (2 and 3 weeks after birth) WT (n = 8) and Snx25+/− mice (n = 6). 2w, p = 0.288; 3w, p = 0.016. g, gram. (b) Size distribution of DRG neuron diameters is plotted for 3-week-old WT and Snx25+/− mice (L4 level, WT (blue columns): 1551 cells from 3 mice; Snx25+/− mice (red columns): 2036 cells from 3 mice). X-axis values indicate the maximum diameter in each 5-μm range. Numbers above or inside columns are the actual numbers of cells in each diameter range. (c) Cumulative frequency distribution of DRG neuron diameters. (d) Representative confocal microscopic images showing CGRP- and NF200-immunoreactive neurons in the DRG (L4) of WT and Snx25+/− mice. Scale bars, 100 μm. (e) Left, percentage of CGRP+ cells among Nissl-positive cells (WT: n = 8; Snx25+/−: n = 9 DRG sections from at least 3 different mice of each genotype, p = 0.27). Right, percentage of NF200+ cells among Nissl-positive cells (WT: n = 8; Snx25+/−: n = 9 DRG sections from at least 3 different mice of each genotype, p = 0.544). (f) Representative images of PGP9.5+ immunoreactivities in the plantar skin of WT and Snx25+/− mice. Arrowheads indicate neuronal fibers labeled for PGP9.5. Scale bar, 50 μm. (g) PGP9.5+ region per unit area (μm2) was measured and plotted for each genotype (WT: 44 sections from 3 mice; Snx25+/−: 68 sections from 4 mice, p = 0.805). (h) Representative immunoblot showing TRPV1, TrkA, and SNX25 proteins in the sciatic nerve and spinal cord of WT and Snx25+/− mice. (i) Representative immunofluorescence images showing TrkA-immunoreactive terminals (green fluorescence, arrowheads) in the dorsal horn of the WT and Snx25+/− mice counterstained with DAPI (blue fluorescence). Right, quantification of mean fluorescence intensity (WT: n = 5; Snx25+/−: n = 6 spinal cord sections from 3 different mice of each genotype, p = 0.066). Scale bar, 100 μm. Results are represented as mean ± SEM. Statistical analyses were performed using the two-tailed Student’s t-test. *p < 0.05. n.s., not significant. Representative of three independent experiments (d, f, and i).

