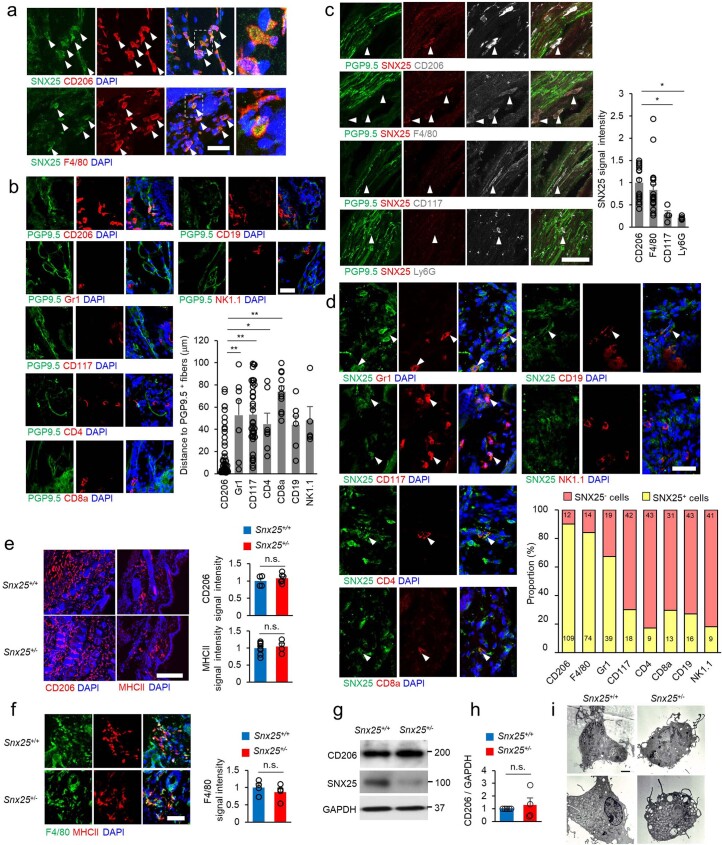
Extended Data Fig. 5. Dermal macrophages located near nerve fibers express SNX25.
(a) Confocal microscopic images of the hind paw skin immunolabeled for SNX25 and macrophage markers (CD206 (upper panels) or F4/80 (lower panels)) of WT mice. Scale bar, 50 μm. The rightmost panels are enlarged images of the boxed areas in the panels to their left. Arrowheads indicate cells double labeled for SNX25 and macrophage markers. (b) Confocal microscopic images of hind paw skin immunolabeled for PGP9.5 (green) and the indicated cell-specific markers (red) of WT mice. Scale bar, 50 μm. The summary graph shows the distance between a PGP9.5+ fiber and each specific marker+ cell. CD206: n = 56; Gr1: n = 7; CD117: n = 36; CD4: n = 7; CD8a: n = 11; CD19: n = 6; NK1.1: n = 5 from at least 3 different mice. The other myeloid cells are considerably further from fibers, but a few neutrophils (Gr1) and mast cells (CD117) are localized near fibers. CD206/Gr1, p = 0.003; CD206/CD117, p = 6.12e-10; CD206/CD4, p = 0.046; CD206/CD8a, p = 6.59e-10. (c) Confocal microscopic images of the hind paw skin immunolabeled for PGP9.5 (green), SNX25 (red), and the indicated cell-specific markers (white) of WT mice. Scale bar, 50 μm. The summary graph shows the SNX25 fluorescence intensity in each specific marker+ cell located near a fiber. CD206: n = 15; F4/80: n = 19; CD117: n = 4; Ly6G: n = 4 from at least 3 different mice. CD206/CD117, p = 0.036; CD206/Ly6G, p = 0.017. (d) Confocal microscopic images of hind paw skin immunolabeled for SNX25 and specific cell markers (Gr1, CD117, CD4, CD8a, CD19, and NK1.1) in WT mice. Each antibody was used as a marker for neutrophils, mast cells, helper T cells, killer T cells, B cells, and NK cells, respectively. Scale bar, 50 μm. The summary graph shows the proportion of SNX25+ cells (yellow column) in each specific marker+ cells. The percentages of SNX25+ cells are 90.1% (CD206), 84.1% (F4/80), 67.2% (Gr1), 30.0% (CD117), 17.3% (CD4), 29.5% (CD8a), 27.1% (CD19), and 18.0% (NK1.1). Numbers inside columns are the actual numbers of cells counted. (e) Confocal microscopic images of the hind paw skin immunolabeled for CD206 or MHCII in WT and Snx25+/− mice. Right panel shows quantification of signal intensities for CD206 and MHCII in the two groups of mice (CD206, WT: n = 4; Snx25+/−: n = 6, MHCII, WT: n = 8; Snx25+/−: n = 4 hind paw skin sections from at least 3 different mice). CD206, p = 0.424; MHCII, p = 0.693. Scale bar, 200 μm. (f) Confocal microscopic images of the hind paw skin immunolabeled for F4/80 and MHCII in WT and Snx25+/− mice. Right panel shows quantification of F4/80 signal intensity in the two group of mice (n = 4 hind paw skin sections from 2 different mice, p = 0.429). Scale bar, 50 μm. (g) Representative immunoblot shows the expressions of CD206 and SNX25 proteins in the hind paw skins of WT and Snx25+/− mice. (h) Semi-quantitation of CD206 protein levels in the hind paw skins of WT and Snx25+/− mice (WT: n = 4; Snx25+/−: n = 4, p = 0.649). (i) Electron microscopic images of representative BMDMs derived from WT and Snx25+/− mice. Note that there is no overt difference in the morphology. Scale bar, 2 μm. Results are represented as mean ± SEM. Statistical analyses were performed using the two-tailed Student’s t-test (e, f) or two-tailed Welch’s t-test (h) or one-way ANOVA (b and c), and significant differences between group means were identified with the Tukey–Kramer test. *p < 0.05, **p < 0.01. n.s., not significant. Representative of three (a, b, c, d, e, f) or two (i) independent experiments.

