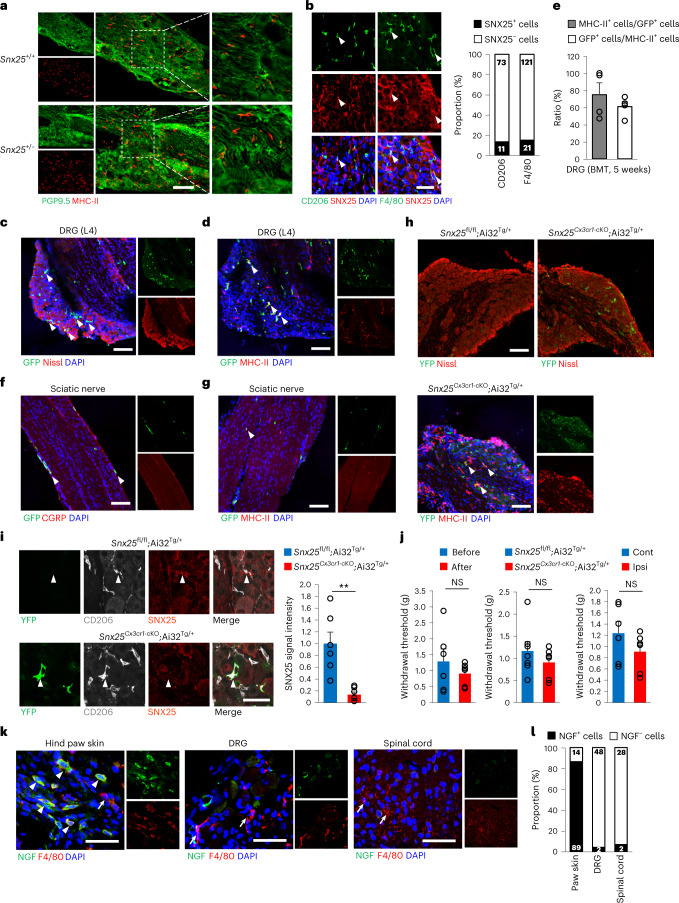
Fig. 8. SNX25+ macrophages in the DRG did not contribute to pain sensitivity.
a, Confocal microscopy of the DRG (L4, naive) immunolabeled for PGP9.5 (green) and MHC-II (red) in WT and Snx25+/− mice. Right, magnified views of boxed areas in the middle panels. Scale bar, 100 μm. b, Confocal microscopic images of the DRG (L4, naive) immunolabeled for macrophage markers (CD206 or F4/80, red) and SNX25 (red) in WT mice. Scale bar, 50 μm. The graph shows the proportion of SNX25+ cells in each specific marker-positive cell population. The numbers in the columns indicate actual cell numbers counted. n = 11 sections from three different mice. c, Confocal microscopy of a DRG (L4) section stained for GFP (green) and fluorescent Nissl (red) in WT mice that received BMT from GFP mice. Arrowheads denote BM-derived GFP+ cells. Scale bar, 100 μm. d, Confocal microscopy of the DRG (L4) double labeled for GFP and MHC-II in the mice shown in c. Arrowheads denote double-labeled cells. Scale bar, 100 μm. e, Percentages of MHC-II+ cells among GFP+ cells and of GFP+ cells among MHC-II+ cells (5 weeks after transplantation) (n = 5 DRG sections from three different mice). f, Confocal microscopy of the sciatic nerve double labeled for GFP and CGRP in the mice shown in c. Arrowheads denote BM-derived GFP+ cells. Scale bar, 100 μm. g, Confocal microscopy of the sciatic nerve double labeled for GFP and MHC-II in the mice shown in c. Arrowhead denote a GFP+MHC-II+ cell. Scale bar, 100 μm. h, Confocal microscopy of the DRG (L4) labeled for fluorescent Nissl (red) and immunolabeled for YFP (green) after injection of 4-OHT directly into DRGs in Snx25Cx3cr1-cKO;Ai32Tg/+ mice (left) and Snx25fl/fl;Ai32Tg/+ mice (right). Scale bar, 100 μm. Bottom, confocal microscopy of the DRG (L4) immunolabeled for MHC-II (red) and YFP (green) after injection of 4-OHT directly into DRGs. Arrowheads indicate cells double labeled for MHC-II and YFP and counterstained with DAPI (blue). Scale bar, 100 μm. i, Confocal microscopy of the DRG immunolabeled for YFP, CD206 and SNX25 in Snx25fl/fl;Ai32Tg/+ mice and Snx25Cx3cr1-cKO;Ai32Tg/+ mice. Arrowheads denote CD206+SNX25+ macrophages. Scale bar, 50 μm. The graph shows the fluorescence intensities of SNX25 in CD206+ macrophages in Snx25Cx3cr1-cKO;Ai32Tg/+ mice (n = 7 sections from three different mice) and Snx25fl/fl;Ai32Tg/+ mice (n = 6 sections from three different mice). P = 0.001. j, VF thresholds before (n = 6) and after (n = 6) 4-OHT injection in Snx25Cx3cr1-cKO;Ai32Tg/+ mice (P = 0.382), Snx25fl/fl;Ai32Tg/+ (n = 7) and Snx25Cx3cr1-cKO;Ai32Tg/+ (n = 6) mice (P = 0.348) and in contralateral (n = 6) and ipsilateral (n = 6) sides of Snx25Cx3cr1-cKO;Ai32Tg/+ mice (P = 0.218). g, gram. k, Confocal microscopy of the hind paw skin, the DRG and the spinal cord immunolabeled for NGF (green) and F4/80 (red) in WT mice. Arrowheads denote double-positive cells and arrows denote NGF−F4/80+ cells. Scale bar, 50 μm. l, Proportion of NGF+ cells (black column) in F4/80+ cells. Numbers inside columns are the actual numbers of cells counted. n = 6 sections from three different mice. Results are represented as mean ± s.e.m. Statistical analyses were performed using the two-tailed Student’s t-test. Representative of three independent experiments (a–d,f–i,k).

