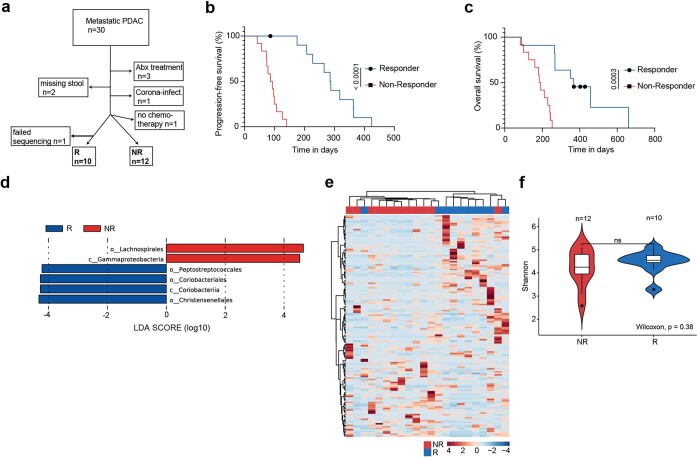
Extended Data Fig. 1. Survival and microbiota analysis of R and NR patients with mPDAC from the Hamburg cohort.
a, 30 patients were recruited to the study. b,c, After exclusion of non-eligible patients as indicated, 23 patients could be analysed for PFS (b) and overall survival (OS) (c). PFS and OS are presented separately for responder (R, n = 11, blue) and non-responder (NR, n = 12, red) patients. d–f, After exclusion of one sample due to sample collection errors that led to sequencing failure, the microbiota of 22 patients was analysed. d, Microbiota LEfSe analysis showing linear discriminant analysis (LDA) score of bacterial taxa enriched in R or NR patients, respectively. e, Genus heat map with Ward clustering of patients. f, Microbiota diversity compared using Shannon index. Boxes indicate 25 to 75% of values (f) and error bars indicate median, significant p-values are indicated and were determined by Gehan–Breslow–Wilcoxon test (b,c) or two-tailed Wilcoxon test (f).

