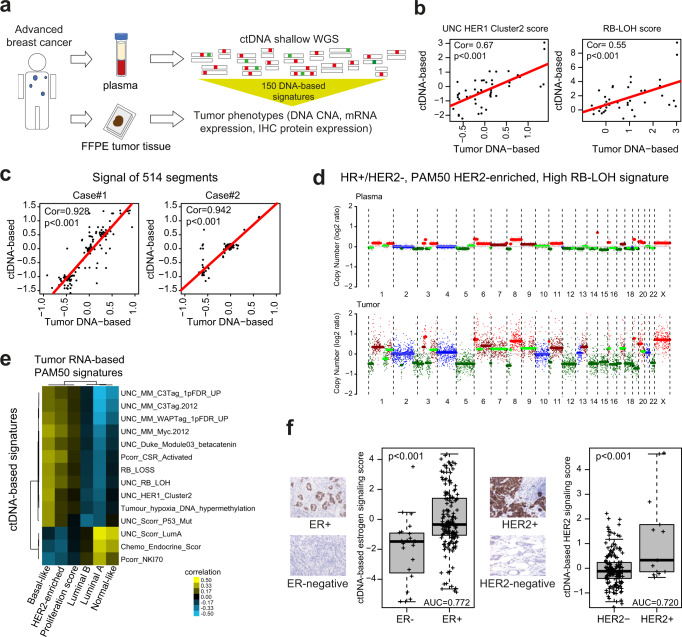
Fig. 2. Circulating tumor DNA (ctDNA) in metastatic breast cancer.
a Plasma samples were obtained from 207 patients (174 with HR+/HER2-, 16 HER2+, 16 TNBC, 1 N/A). After purification of plasma cell-free DNA, shallow whole genome sequencing (shWGS) was performed. Using the ctDNA-based sequencing data from 514 DNA segments, 150 previously developed DNA copy number-based signatures10 tracking a variety of biological processes were applied in patients with a Tumor cell Fraction (TF) ≥3%. Individual scores for each signature were obtained. The complete names of the signatures, references and gene lists can be found in Supplementary Data 1. b Examples of correlation between the scores of the UNC_HER1_Cluster2 (p < 0.001) and the RB-LOH (p < 0.001) signatures when determined in plasma versus tumor tissue (the correlations for the other signatures can be found in Supplementary Data 4). Of note, tissue samples were obtained at different timepoints than the plasma samples. c Examples of correlations of 514 DNA signals between plasma and tissue in two single patients (case#1 p < 0.001, case#2 p < 0.001). Correlation coefficients (Cor) and p in b and c were determined by Pearson correlation. d Example of copy number alterations (CNA) plots of matched timepoint plasma and tissue samples of a HR+/HER2- tumour, PAM50 HER2-enriched and high RB-LOH signature score. e Unsupervised cluster heatmap analysis of Pearson´s correlation coefficients obtained by comparing the scores of the top individual ctDNA-based signature versus the scores of each individual PAM50 RNA-based tissue signature across 58 matched-timepoint paired plasma-tissue cases. Correlation values can be found in Supplementary Data 6. f Boxplots of a ctDNA-based signatures tracking ER-related biology in ER-negative (n = 23) and ER+ tumors (n = 155) (p < 0.001) (left) and boxplots of a ctDNA-based signatures tracking HER2-related biology in HER2- (n = 165) and HER2+ tumors (n = 13) (p < 0.001) (right). P-value (P) was determined by two-tailed unpaired t-tests. For the boxplot, center line indicates median; box limits indicate upper and lower quartiles; whiskers indicate 1.5× interquartile range. Examples of ER and HER2 immunohistochemistry (ICH) stainings (20X) are provided. Source data are provided as a Source Data file.

