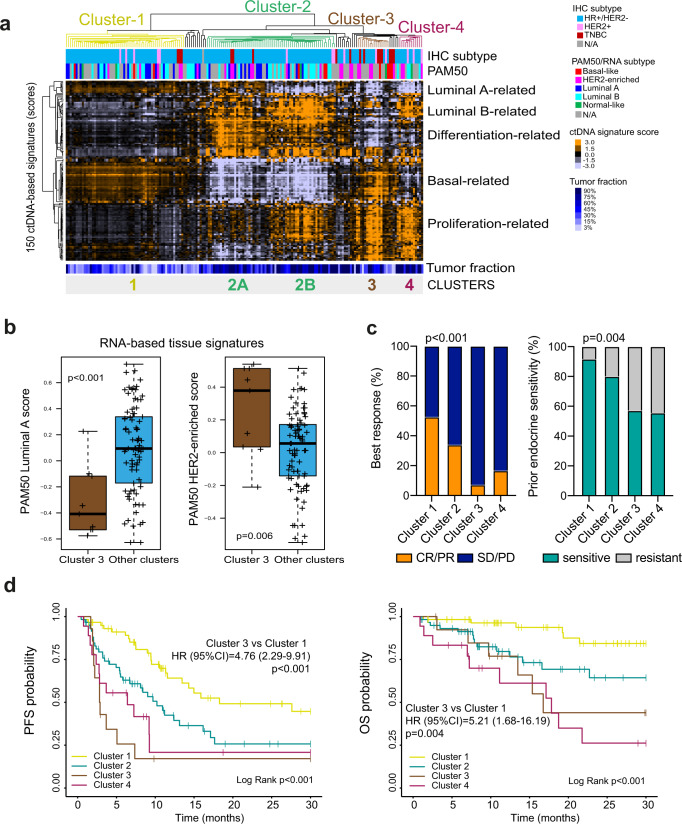
Fig. 4. ctDNA-based profiling of metastatic breast cancer.
a Unsupervised cluster analysis of 178 plasma samples with a TF ≥3% (columns) and the scores of 150 ctDNA-based signatures (rows). Orange and violet colors represent scores above and below the median score of the signature across the dataset. Below the array tree, the IHC subtype and the PAM50 molecular subtype are shown for each sample. Four clusters of samples (clusters 1 to 4) were identified. Within cluster 2, two subgroups of samples were also identified (clusters 2A and 2B). b Expression of 2 tissue PAM50 RNA-based signatures (i.e., Luminal A [p = 0.0005] and HER2-enriched [p = 0.006]) in cluster 3 versus the other clusters. This analysis was performed in 107 paired plasma and tumor tissue samples. Of note, 58 tumor tissue samples were obtained at the same timepoint as the plasma sample and 49 tumor tissue samples were obtained at different timepoints prior to obtaining the plasma sample. P-values (p) were determined by two-tailed unpaired t-tests. For the boxplot, center line indicates median; box limits indicate upper and lower quartiles; whiskers indicate 1.5× interquartile range. c Association of ctDNA-based clusters with response to endocrine therapy and CDK4/6 inhibition (p < 0.001) and prior endocrine sensitivity (p < 0.001) in 152 patients from the combined CDK-Validation-1 and CDK-Validation-2 cohorts. P-values (p) were determined by Fisher’s exact test. d Kaplan-Meier curves of PFS (Log Rank p < 0.001; Cluster 3 vs Cluster 1 p < 0.001) (left) and OS (Log Rank p < 0.001; Cluster 3 vs. Cluster 1 p = 0.004) (right) of the 4 ctDNA-based clusters in 152 patients of the combined CDK-Validation-1 and CDK-Validation-2 cohorts. Source data are provided as a Source Data file.

