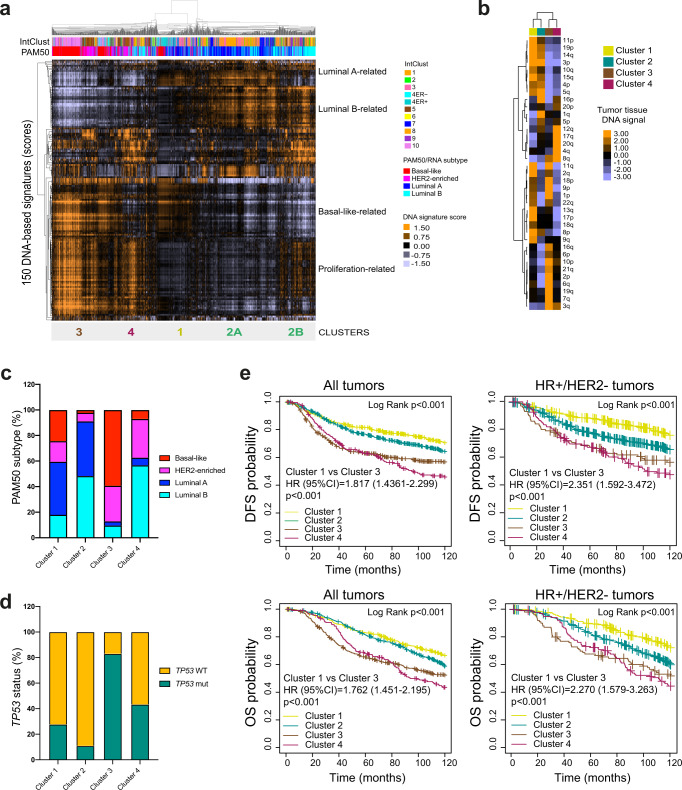
Fig. 5. DNA-based tumor profiles in tissue samples and association with clinical outcomes.
a Unsupervised cluster analysis of 1,689 tumor samples (columns) from METABRIC dataset29 and the 150 DNA-based signatures scores (rows). Orange and violet colors represent scores above and below the median value of the signature across the dataset. Below the array tree, the InctClust classification29 and the PAM50 molecular subtypes are shown for each sample. The predictor of the 4 clusters, which was derived from plasma ctDNA data in the Plasma-1 cohort (see Fig. 4), was applied in METABRIC and the results for each sample are shown below the data matrix. b Heatmap of signals from individual chromosomic regions found significantly associated with each cluster 1-4. Differentially represented segments were determined using a multi-class SAM analysis (FDR < 5%) c PAM50 molecular subtype distribution across the 4 DNA-based clusters in 1689 breast tumors of the METABRIC dataset29. d TP53 mutation distribution across the 4 DNA-based clusters in 1,517 breast tumors of the METABRIC dataset29. e Kaplan-Meier curves of DFS (left) and OS (right) of the 4 DNA-based clusters assessed in all tumors (n = 1689) (DFS Log Rank p = 3.51e-10; Cluster 1 vs 3 p < 0.001; OS Log Rank p = 1.56e−09; Cluster 1 vs 3 p < 0.001) and HR+/HER2- tumors (n = 1131) (DFS Log Rank p < 0.001; Cluster 1 vs 3 p < 0.001; OS Log Rank p < 0.001; Cluster 1 vs 3 p < 0.001) of the METABRIC database29. Source data are provided as a Source Data file.

