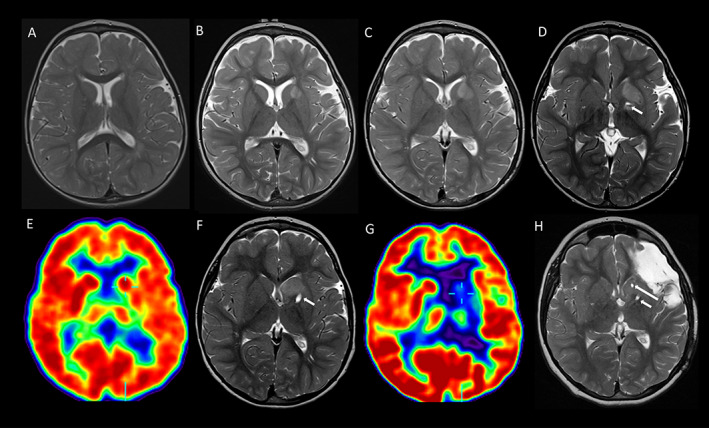
FIGURE 1.

Serial T2‐weighted axial MRI and FDG‐PET images (radiological view) demonstrating the left basal ganglia abnormalities. MRI at age 1.6 (A), 2.1 (B), 2.4 (C), 2.6 (D), 3.9 (F), and 10 (H) years demonstrate initial progression then stability of the left basal ganglia abnormality, maximal in the caudate head. Tracts from the first (short arrow) and second (long arrow) biopsies are evident in (D, F, and H). FDG‐PET at age 3.1 years (E) shows normal metabolism in both basal ganglia and thalami, and relative hypometabolism in the left hemisphere. FDG‐PET at age 6.3 years (G) shows marked hypometabolism in the left basal ganglia and thalamus.
