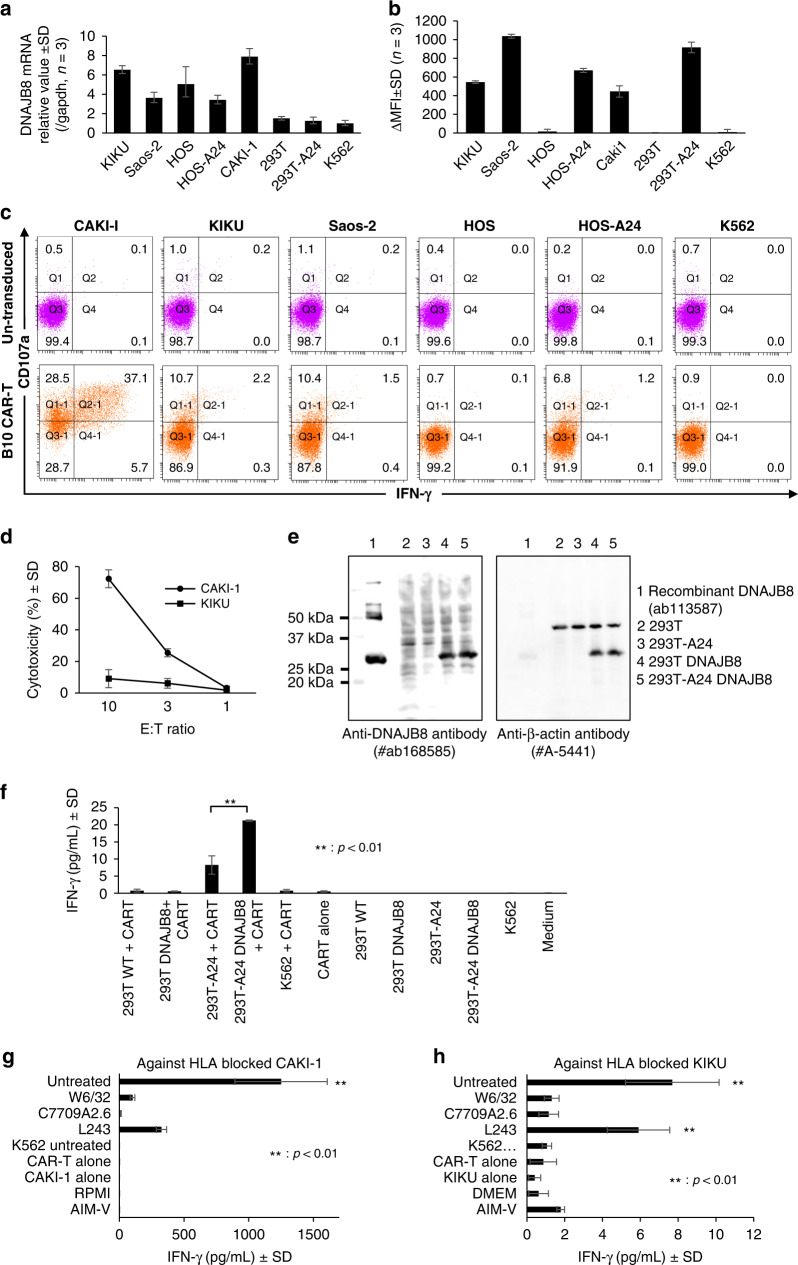
Fig. 3. Reactivity of B10 CAR-T cells against various cell lines.
a Quantitative RT-PCR of DNAJB8 among the target cells. Data are shown as the mean 2–∆∆Ct ± SD normalised by comparison with GAPDH. b HLA-A*24:02 expression on the target cells defined by staining with HLA-A24-specific monoclonal antibody (C7709A2.6). Data are shown as the difference between samples and negative controls without primary monoclonal antibody in units of the mean fluorescence intensity (ΔMFI). c Flow cytometric CD107a expression and IFN-γ production of CAR-T cells against target cells. The experiments were performed using four healthy independent donors. Representative results are shown. d Lactate dehydrogenase release assay of cytotoxicity against CAKI-1 and KIKU cells. e Western blotting analysis of hDNAJB8 and β-actin. f–h IFN-γ levels in the supernatant after co-culture of B10 CAR-T cells with the indicated target cells. g, h IFN-γ production of B10 CAR-T cells after treatment with HLA-blocking antibodies. CAKI-1 (g) and KIKU (h) were used as the target cells.

