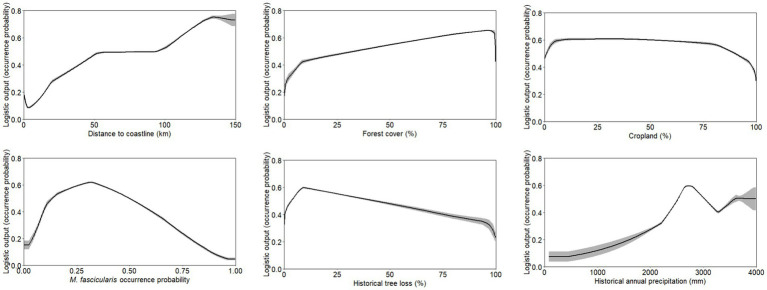
Figure 6.
Response curve outputs from MaxEnt model demonstrating the range of suitability for human knowlesi malaria occurrence based on only key covariates with highest model percent contribution as described in Table 1. Grey band indicates standard deviation of the model output.

