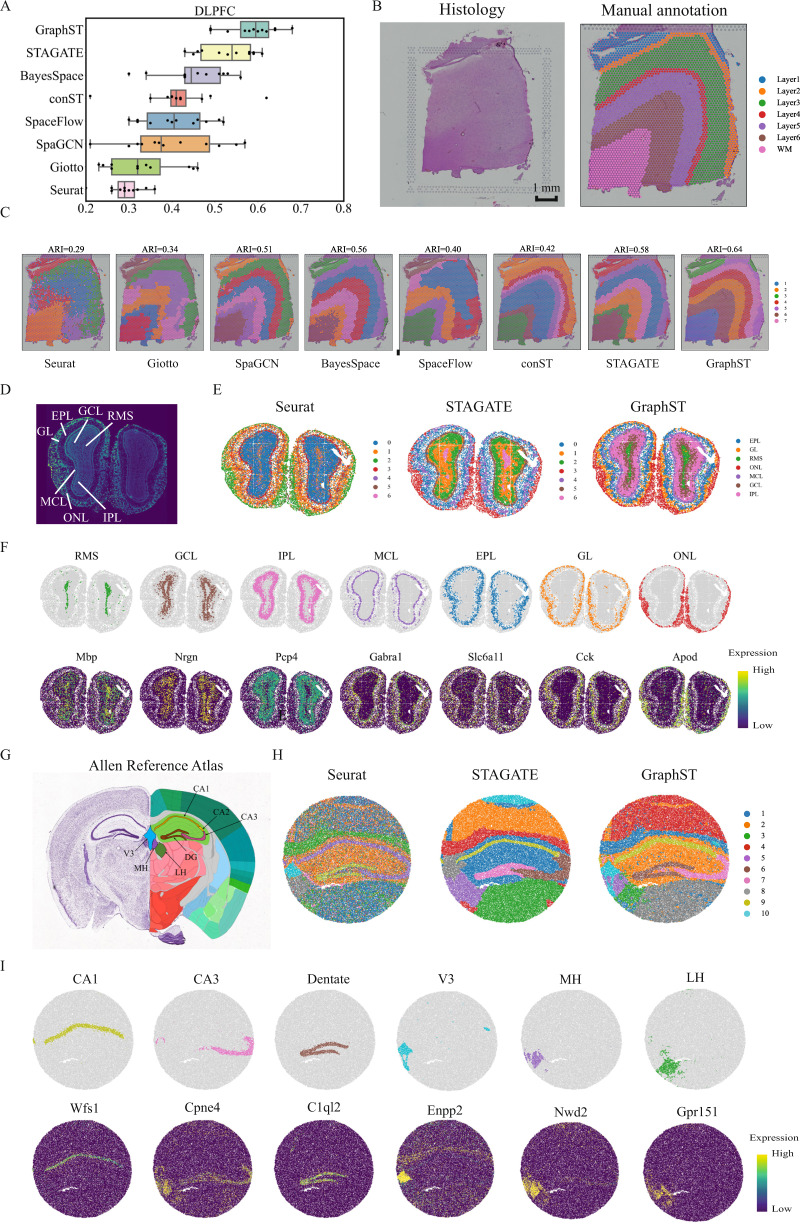
Fig. 2. GraphST clustering improves the identification of tissue structures in the human dorsolateral prefrontal cortex (DLPFC), mouse olfactory bulb, and mouse hippocampus tissue.
A Boxplots of adjusted rand index (ARI) scores of the eight methods applied to the 12 DLPFC slices. In the boxplot, the center line denotes the median, box limits denote the upper and lower quartiles, and whiskers denote the 1.5× interquartile range. B H&E image and manual annotation from the original study. C Clustering results by nonspatial and spatial methods, Seurat, Giotto, SpaGCN, BayesSpace, SpaceFlow, conST, STAGATE, and GraphST on slice 151673 of the DLPFC dataset. Manual annotations and clustering results of the other DLPFC slices are shown in Supplementary Fig. S1. D Laminar organization of the mouse olfactory bulb annotated using the DAPI-stained image. E Spatial domains identified by Seurat, STAGATE, and GraphST in the mouse olfactory bulb Stereo-seq data. F Visualization of the spatial domains identified by GraphST and the corresponding marker gene expressions. The identified domains are aligned with the annotated laminar organization of the mouse olfactory bulb. G Allen Mouse Brain Atlas with the hippocampus region annotated. H Spatial domains identified by Seurat, STAGATE, and GraphST in mouse hippocampus tissue acquired with Slide-seqV2. I Visualization of the spatial domains identified by GraphST and the corresponding marker gene expressions. The identified domains are aligned with the annotated hippocampus region of the Allen Mouse Brain Atlas.

