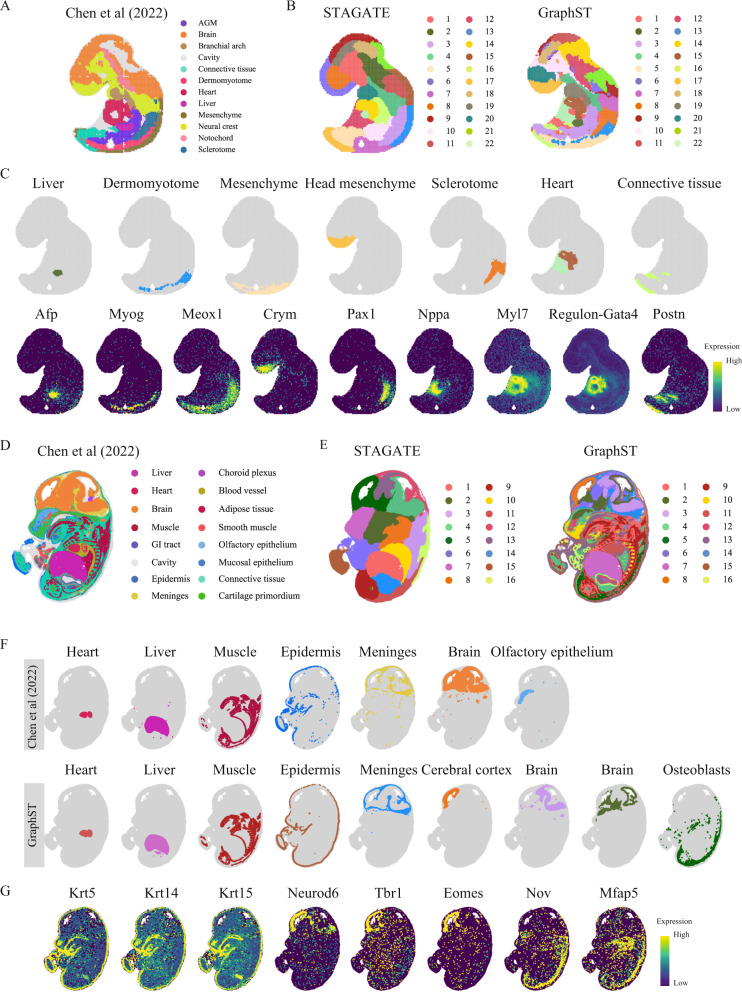
Fig. 3. GraphST enables accurate identification of different organs in the Stereo-seq mouse embryo.
A Tissue domain annotations of the E9.5 mouse embryo data taken from the original Stereo-seq study wherein the clusters were first identified using Leiden clustering from SCANPY and then annotated using differentially expressed genes. B Clustering results of STAGATE and GraphST on the E9.5 mouse embryo data. C Visualization of selected spatial domains identified by GraphST and the corresponding marker gene expressions. D Tissue domain annotations of the E14.5 mouse embryo data obtained from the original Stereo-seq study. E Clustering results by STAGATE and GraphST on the E14.5 mouse embryo. F Visualization of selected spatial domains identified by the original Stereo-seq study and GraphST, respectively. G Visualization of marker gene expressions supporting the identified domains.

