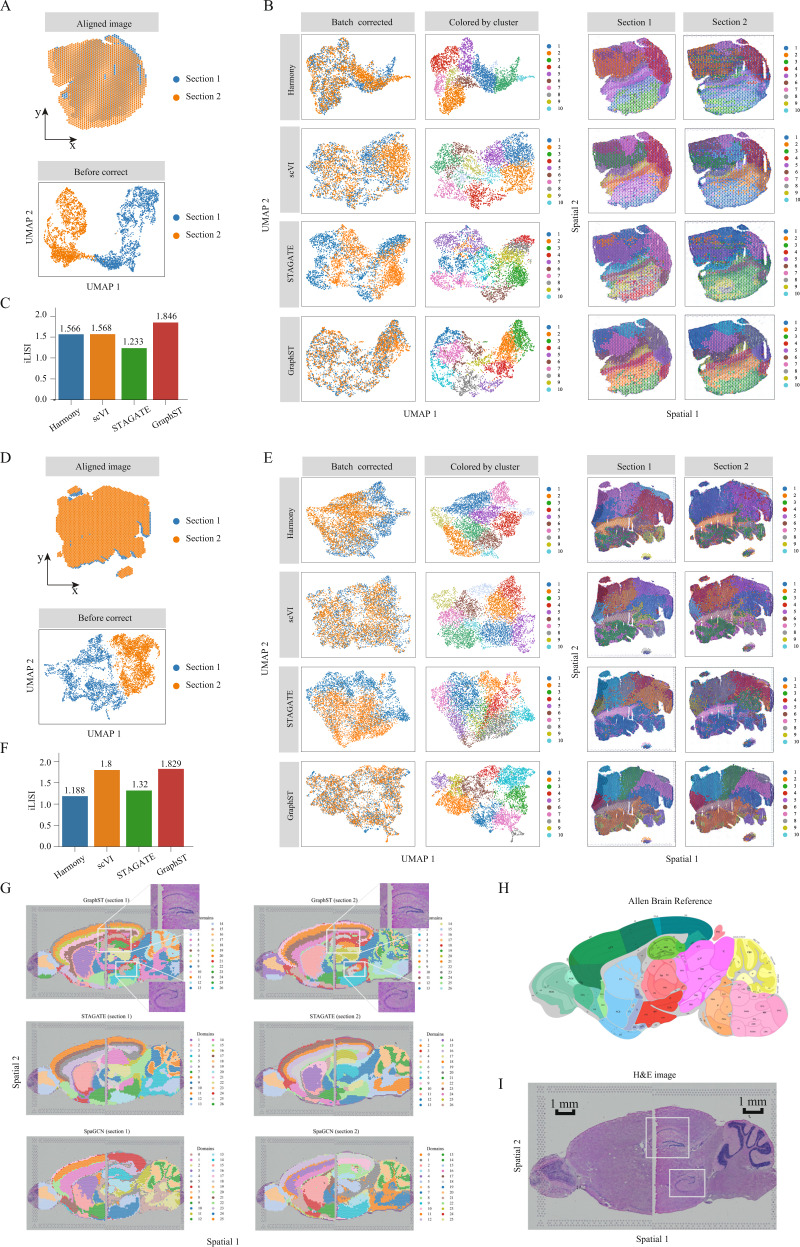
Fig. 4. GraphST enables accurate vertical and horizontal integrations of ST data on mouse breast cancer and mouse brain anterior and posterior data, respectively.
A First set of mouse breast cancer sample images aligned with the PASTE algorithm and plotted before batch effect correction. B UMAP plots after batch effect correction and spatial clustering results from Harmony, scVI, STAGATE, and GraphST. Spots in the second column are colored according to the spatial domains identified by the respective clustering methods. C Barplots of iLISI metric for batch correction results from different methods on the first set of samples. D Second set of mouse breast cancer sample images aligned and UMAP plot before batch effect correction. E UMAP plots after batch effect correction and the spatial clusters detected by Harmony, scVI, STAGATE, and GraphST on sections 1 and 2, respectively. Similarly, spots in the second column are colored according to the spatial domains identified by the respective methods. F Barplots of iLISI metric for batch correction results from different methods on the second set of samples. G Horizontal integration results with two mouse brain samples, of which each consists of anterior and posterior brain sections. Top: spatial joint domains identified by GraphST on sections 1 and 2. Middle: spatial joint domains identified by STAGATE. Bottom: spatial joint domains identified by SpaGCN. H Annotated brain section image from Allen Mouse Brain Atlas for reference. I H&E image of mouse brain anterior and posterior.

