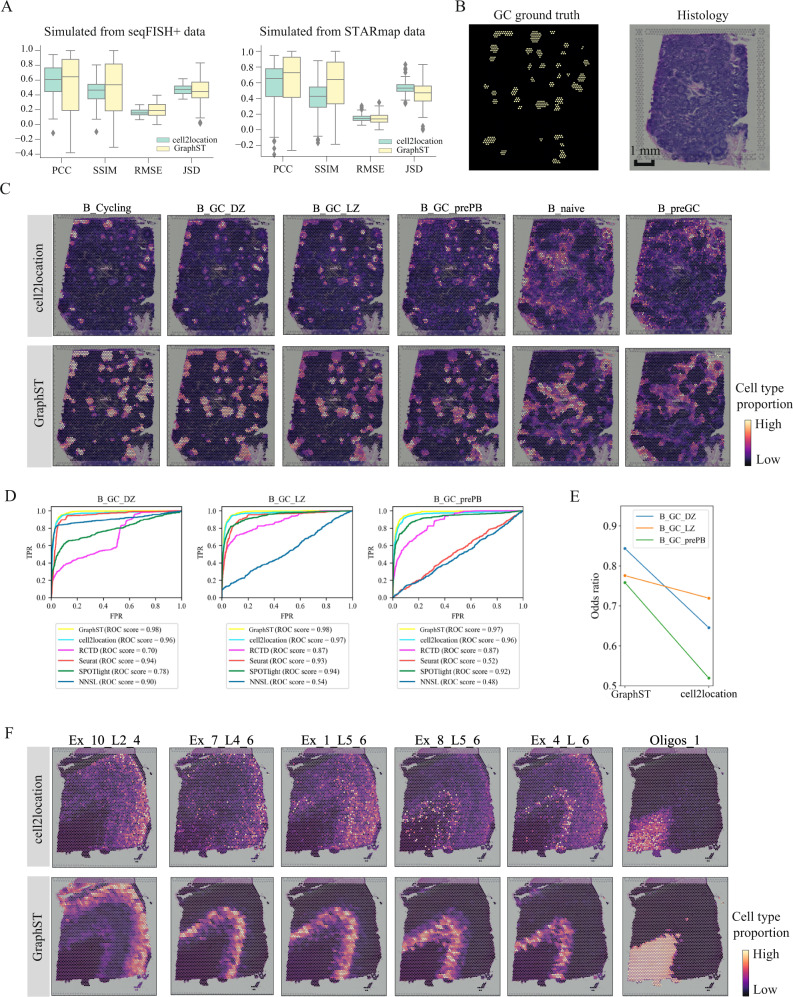
Fig. 5. Comparing the accuracy of GraphST with top deconvolution method cell2location in predicting spatial distributions of scRNA-seq data with simulated data, human lymph node, and the slice 151673 of DLPFC.
A Boxplots of PCC, SSIM, RMSE, and JSD metrics for cell2location and GraphST results on simulated data created from seqFISH+ and STARmap experimental data. In the boxplot, the center line denotes the median, box limits denote the upper and lower quartiles, and whiskers denote the 1.5× interquartile range. n = 8 (12) different predicted cell types for simulated data created from seqFISH+ (STARmap) experimental data. B Left, annotations of germinal center (GC) locations from cell2location’s study (GC locations annotated with yellow). Right, H&E image of human lymph node data. C Comparison between cell2location and GraphST on the spatial distributions of selected cell types, namely B_Cycling, B_GC_DZ, B_GC_LZ, B_GC_prePB, B_naive, and B_preGC. D Quantitative evaluation via AUC of three cell types (B_GC_DZ, B_GC_LZ, and B_GC_prePB) localized in the GCs using the annotated locations shown in (B). E Quantitative evaluation of GC cell type mapping of three cell types (B_GC_DZ, B_GC_LZ, and B_GC_prePB) between cell2location and GraphST using the odds ratio metric. F Comparison between cell2location and GraphST on the spatial distribution of cell types Ex_10_L2_4, Ex_7_L4_6, Ex_1_L5_6, Ex_8_L5_6, Ex_4_L_6, and Oligos_1 with slice 151673 of the DLPFC dataset.

