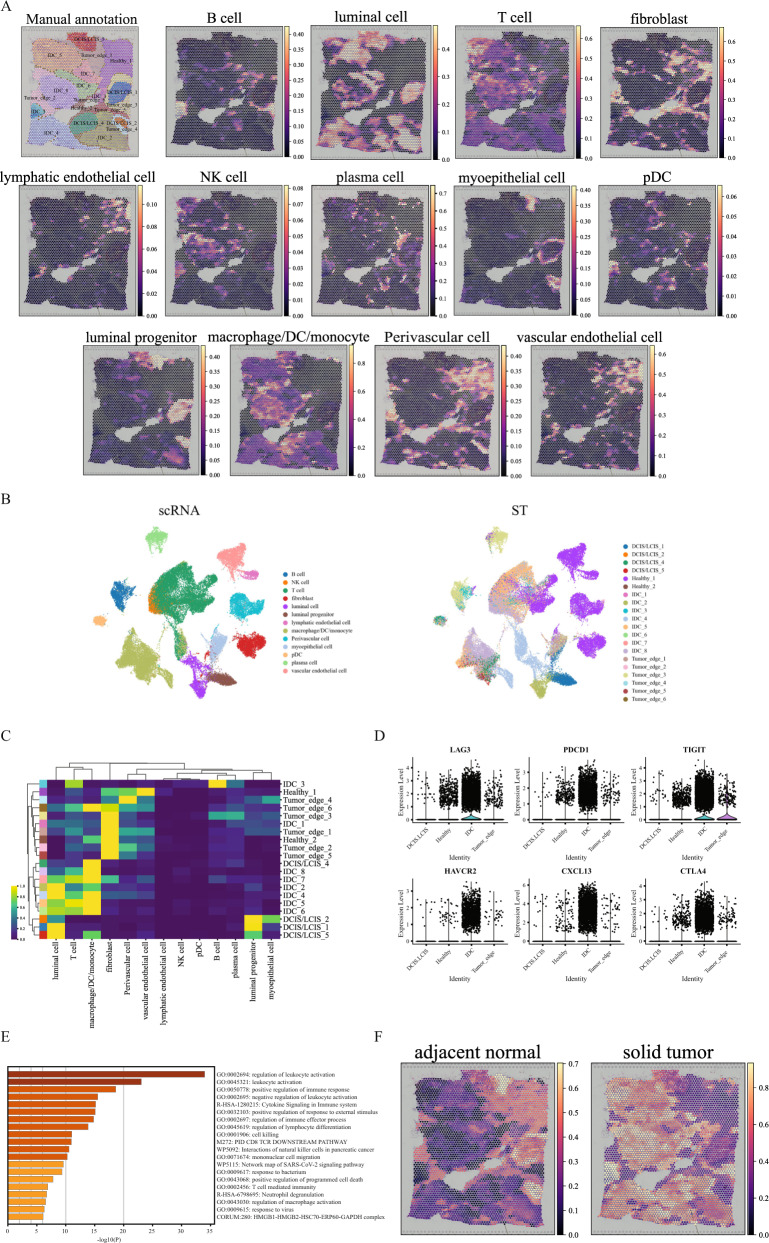
Fig. 6. GraphST enables comprehensive and accurate spatial mapping of scRNA-seq data in human breast cancer data.
A Manual annotation and spatial distribution of major cell types mapped by GraphST, namely B cell, luminal cell, T cell, fibroblast, lymphatic endothelial cell, NK cell, plasma cell, myoepithelial cell, pDC, luminal progenitor, macrophage/DC/monocyte, Perivascular cell, and vascular endothelial cell. B Visualization of scRNA-seq data and spatial localization of cell types with UMAP generated from the output cell representations of GraphST. C Heatmap of the spatial distribution of cell types. D The gene expression of six T-cell exhaustion-related markers in different annotated domains. E Functional enrichment results of the IDC domain specific differentially expressed genes. Statistical significance was assessed by the hypergeometric test, and p-values were adjusted by the Benjamini–Hochberg p-value correction algorithm. The statistical test was one-sided. F Predicted spatial distribution of cells from two sample types, adjacent normal and solid tumor.

