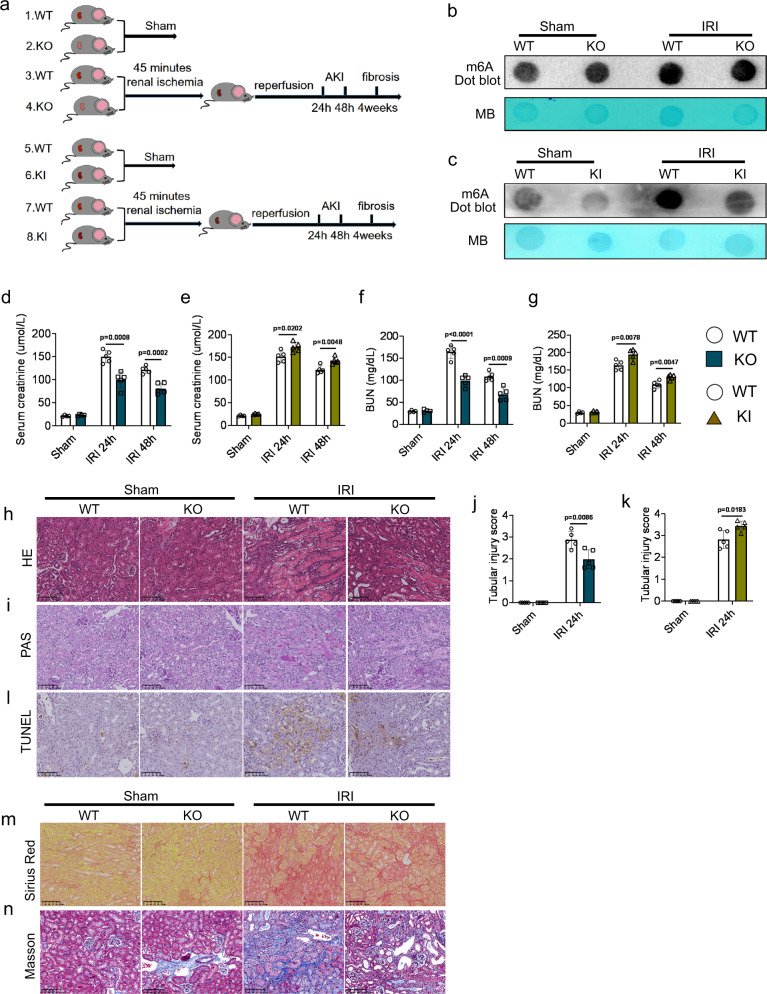
Fig. 2. Alkbh5 deficiency or overexpression altered I/R-induced AKI and fibrosis.
a Schematic illustrating experiment groups. b, c m6A dot blot assessed m6A mRNA methylation of WT, KO, and KI mice in IRI model. d–g Serum creatinine and blood urea nitrogen (BUN) concentrations. h–k Representative hematoxylin and eosin (H&E), periodic acid–Schiff (PAS) staining image and tubular injury score in different groups of renal tissues. l The apoptosis levels in different groups were detected by terminal-deoxynucleoitidyl transferase-mediated nick end labeling (TUNEL) staining. m, n Sirius red and Masson staining were performed 4 weeks after IRI in different groups. (h, i, l, m, n: Magnification: ×200, Scale bar: 100 μm) (h–n: n = 5 for all groups). For d–g, Sham groups, n = 4; IRI 24 h, 48 h groups, n = 5. Each data point represent one animal. Unpaired two-tailed Student’s t-test. Data are showed as means ± SD.

