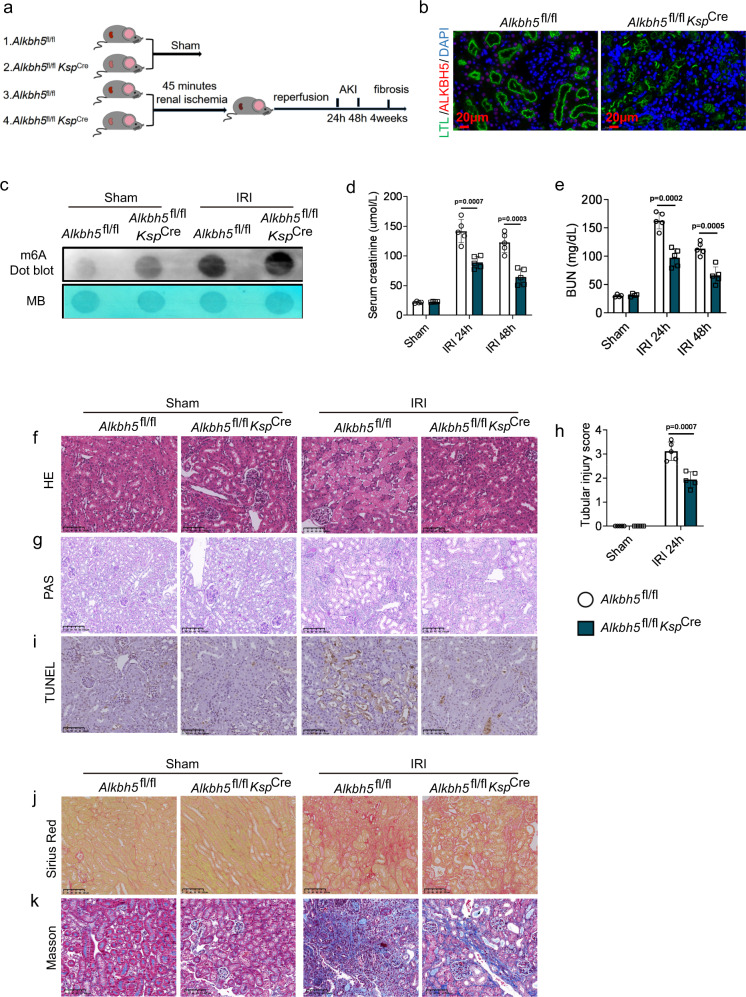
Fig. 3. Alkbh5 deficiency in RTECs protected I/R-induced AKI and fibrosis.
a Schematic illustrating experiment groups and treatment in 4 groups. b Representative IF staining of ALKBH5 (red), LTL (green), and DAPI (blue) in kidney biopsies from Alkbh5fl/fl and Alkbh5fl/flKspCre mice. (Magnification: ×400, Scale bar: 20 μm) (n = 5 for all groups). c m6A dot blot assessed m6A mRNA methylation of Alkbh5fl/fl and Alkbh5fl/flKspCremice in IRI model. d, e Serum creatinine and BUN concentrations. f–h Representative H&E and PAS staining image and tubular injury score in different groups of renal tissues. i The apoptosis levels in different groups were detected by TUNEL staining. j, k Sirius red and Masson staining were performed 4 weeks after IRI in different groups. (f–j: Magnification: ×200, Scale bar: 100 μm) (i–k: n = 4 for sham groups, n = 5 for IRI groups). For d, e, Sham groups, n = 4; IRI 24 h, 48 h groups, n = 5. For h, n = 5 for all groups. Each data point represent one animal, with unpaired Student’s t-test performed. Data are shown as means ± SD. Unpaired two-tailed Student’s t-test.

